Original Lens and publication context
Intel +200% YTD. AMD and Micron tracking. The AI capex narrative is real — but it is not what is moving these names. Option hedging may contribute, but a record-long aggregate gamma estimate does not by itself establish buying pressure. And the S&P 500 sits roughly 220 points above a flip level that, if breached, weaponises the same book in the opposite direction.
- Intel is up 90% in a month and more than 200% year-to-date, with AMD and Micron tracking. The AI-capex narrative is right in direction but it is not setting price — dealer hedging may contribute, but the sign and composition of the net book must be established.
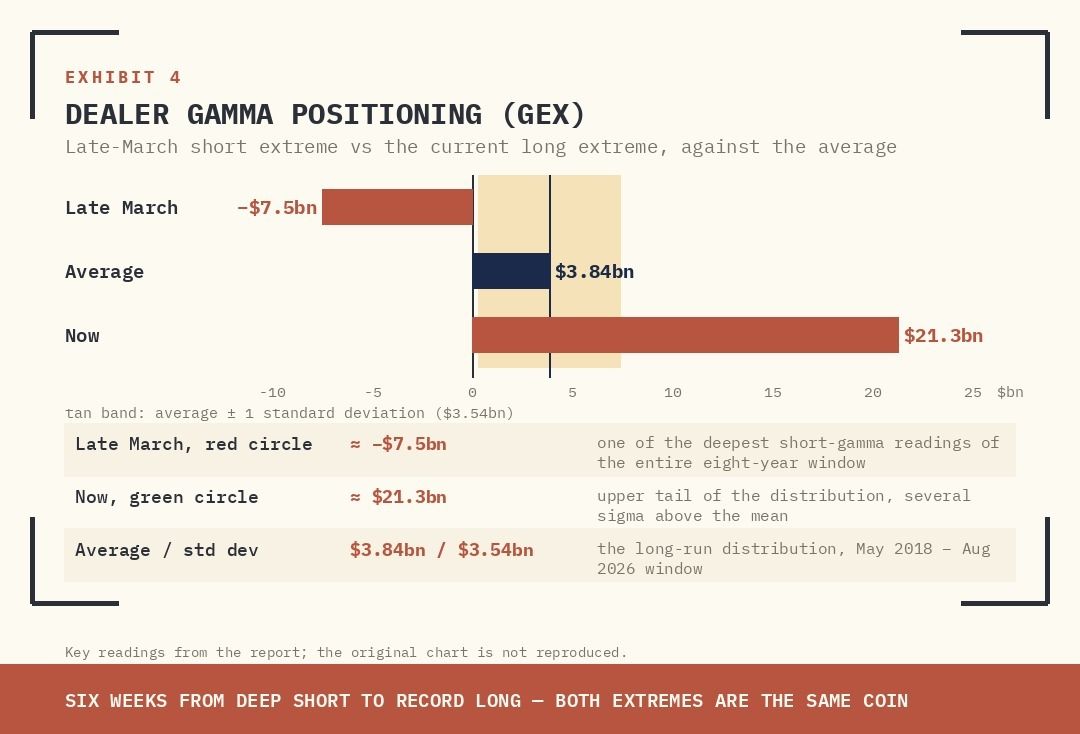
- The dealer book has flipped in six weeks from one of its deepest short-gamma readings (~-$7.5bn in late March) to ~$21.3bn long, several sigma above a $3.84bn average. SPX call notional has scaled to $2.6 trillion; 0DTE call mountains turn hedging into a tractor beam.
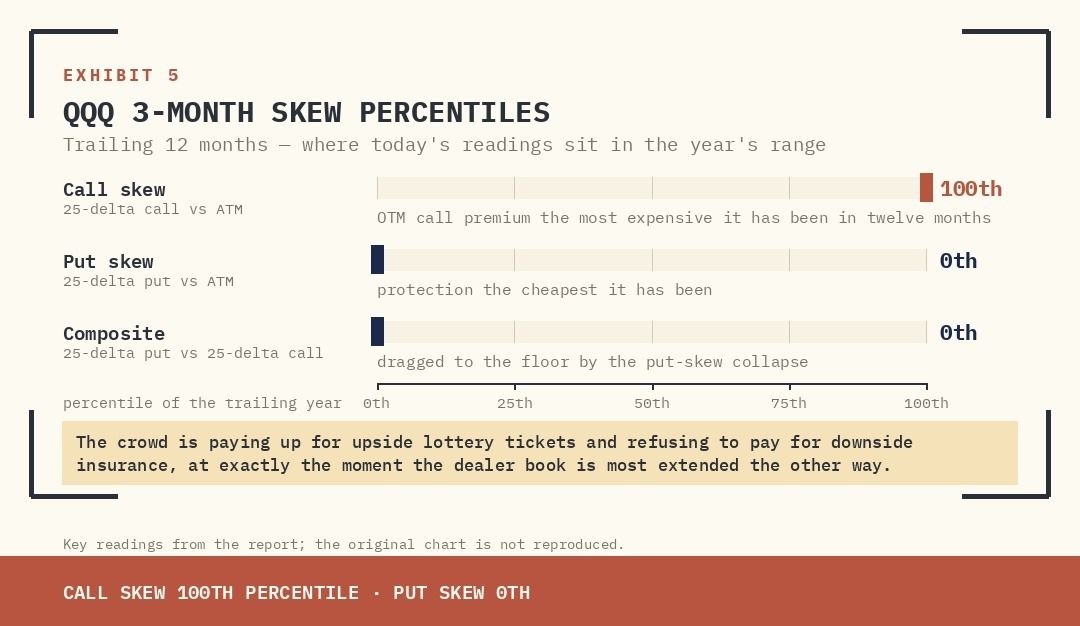
- Skew is telling on the crowd: QQQ three-month call skew sits at the 100th percentile of the trailing year, put skew at the 0th. The crowd pays up for upside lottery tickets and refuses to pay for protection while the dealer book is most extended.
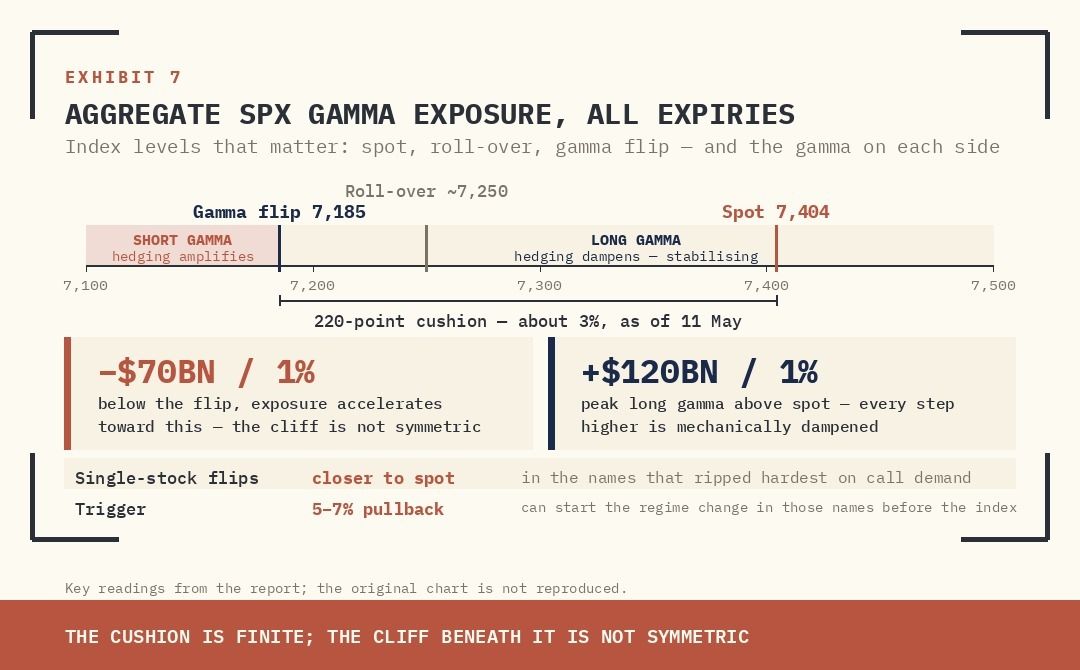
- A long-gamma cushion is a coiled spring, not a floor: the S&P 500 at 7,404 sits roughly 220 points above the 7,185 gamma flip, below which dealer gamma accelerates toward -$70bn per 1% move. Single-stock flips in the hardest-ripped names sit closer still.
- Position: trim semi-driven beta into mechanical strength; buy protection while put skew is at the 0th percentile, financed by selling rich upside calls; do not sell premium against names with 0DTE call mountains; watch single-stock flip levels as the canary. Position for the regime change.
EXECUTIVE VIEW
TRIGGER | INTEL +90% IN 30 DAYS, +200% YTD. AMD, MICRON TRACKING. NARRATIVE IS AI CAPEX. DRIVER IS MECHANICAL. |
|---|---|
FLOW | Dealer aggregate gamma has flipped from extremely short (late March, ~-$7.5b) to one of the longest positions on record (~$21.3b) in six weeks. QQQ call skew at the 100th percentile. Put skew at the 0th. |
RISK | Net long-gamma hedging usually dampens both upward and downward moves. Amplification can emerge if the net book turns short gamma. |
PRICE | SPX gamma flip 7,185 vs spot 7,404 — a 3% cushion. Individual semi names carry their own flips, and they are sharper. |
POSITION | Trim semi exposure into mechanical strength. Buy protection while put skew is at the 0th percentile. Do not sell premium against names with 0DTE call mountains. |
TRIGGER
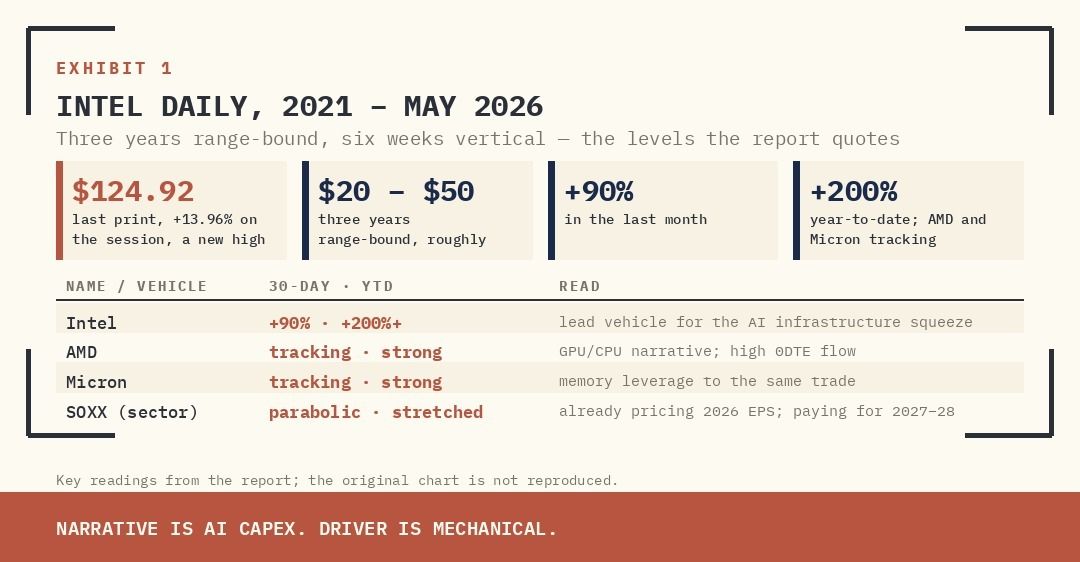
Intel is up 90% in the last month and more than 200% year-to-date. AMD and Micron are tracking. Other semiconductor and hardware names are riding the same flow. The narrative is the AI infrastructure buildout — hyperscaler capex, GPUs, CPUs, networking, power. The narrative is correct in direction. It is not what is setting price.
Supplied archive exhibit · original labels. Read alongside the editorial corrections.
The chart is the tell. After three years range-bound between roughly $20 and $50, Intel has gone vertical — closing $124.92 on the print shown, a 13.96% single-session move into a new high. Parabolic shapes of this character are not produced by quarterly cash flow updates. They are produced by something else doing the buying, and that something else has a name: the dealer hedge book.
On fundamentals, the semis are not cheap. The SOXX cycle is already pricing 2026 earnings in full. From here, the buyer is paying for 2027 and 2028 growth in a sector whose cyclicality has not been repealed — only postponed by a capex super-cycle that the entire street is now positioned for. What is actually driving the daily mark is something more mechanical, more brittle, and considerably less discussed on the tape: option-related hedging associated with a shift in speculative positioning; the direction of that hedging depends on the dealers’ net exposures.
The risk management tool has become a market risk in and of itself. The options book is the price discovery mechanism. The cash market is its hedge.
FLOW
Delta, gamma, and the mechanics of forced buying
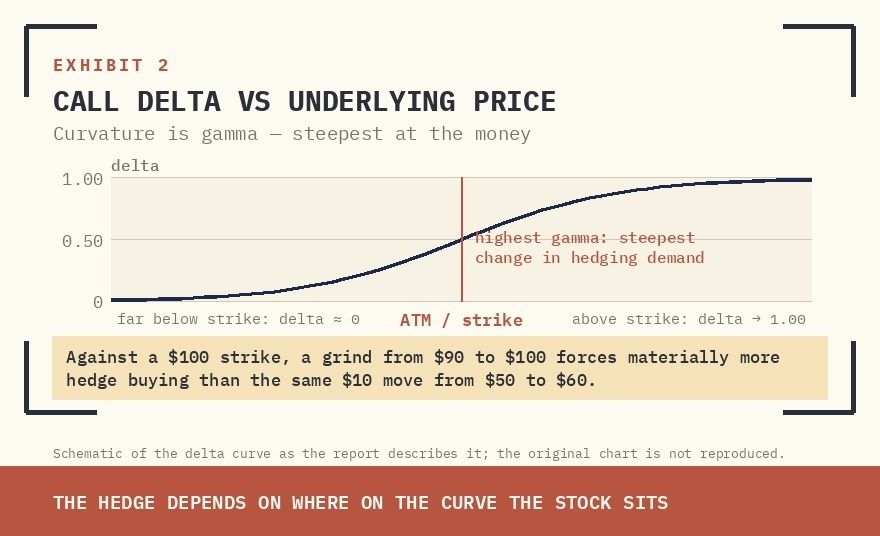
When a retail or institutional buyer lifts a call, a dealer is on the other side. The dealer does not want directional exposure; the dealer wants to harvest premium. To stay neutral, the dealer hedges by buying the underlying in proportion to the option's delta. As the stock rises and the option moves towards or through its strike, delta rises — that rate of change is gamma — and the dealer is forced to buy more. More buying lifts the stock. The higher stock lifts delta further. The dealer buys again. This is the gamma squeeze: a reflexive feedback loop in which the cash tape is no longer pricing the company but the dealer's hedge book.
Supplied archive exhibit · original labels. Read alongside the editorial corrections.
The delta curve is non-linear by design. Far below the strike, delta sits near zero — the dealer hedges almost nothing. Approaching ATM, the curve inflects steeply through 0.50, and through that inflection lies the highest gamma: the steepest rate of change in hedging demand. Above the strike, delta saturates toward 1.00. The dealer's required hedge is not a function of how far the stock has moved; it is a function of where on this curve it sits. A stock grinding from $90 to $100 against a $100 strike forces materially more hedge buying than the same dollar move from $50 to $60 against the same strike — even though both moves are $10.
The size of the field
Supplied archive exhibit · original labels. Read alongside the editorial corrections.
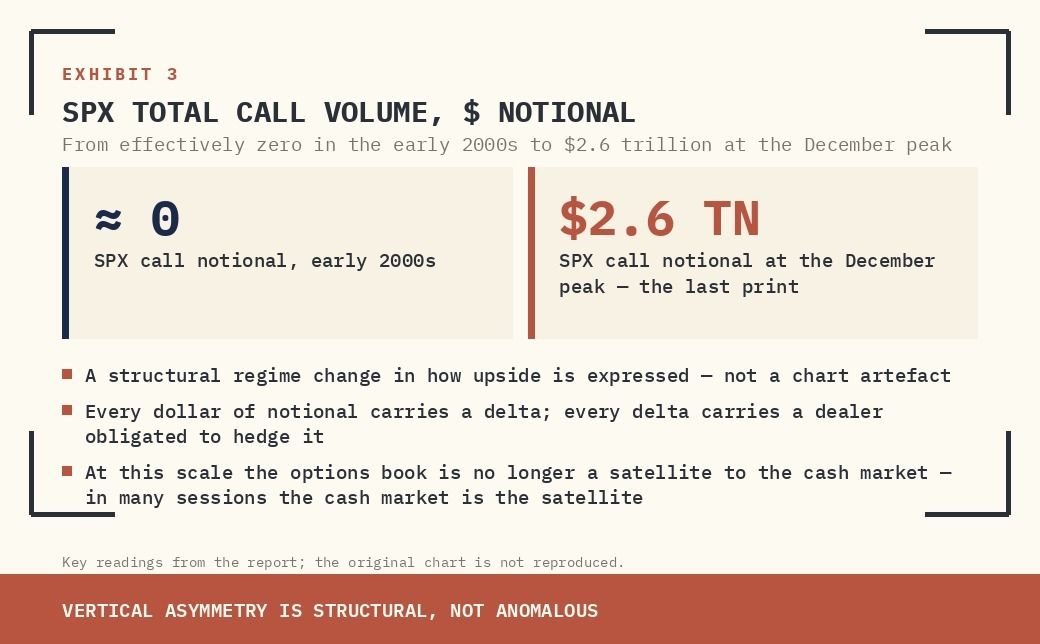
SPX call notional has scaled from effectively zero in the early 2000s to $2.6 trillion at the December peak. The vertical asymmetry is not a chart artefact — it is a structural regime change in how upside is expressed in this market. Every dollar of that notional carries a delta. Every delta carries a counterparty dealer obligated to hedge it. At this scale, the options book is no longer a satellite to the cash market. In many sessions, the cash market is the satellite — its tape the second-order shadow of an options book that has already decided where price needs to go.
0DTE: the gamma accelerant
Gamma is highest in options closest to expiry. The proliferation of zero-days-to-expiry (0DTE) options has therefore weaponised dealer hedging at the highest sensitivity. A 0DTE call mountain at a strike just above spot creates a tractor beam: any drift up forces the dealer to buy aggressively, which pulls the stock up, which forces more buying — all of it compressed into hours, not days. What the chart presents as conviction is, in many cases, a mechanical artefact of dealer Greeks rebalancing in real time.
The dealer book has flipped — extremely
Supplied archive exhibit · original labels. Read alongside the editorial corrections.
The chart compresses the regime change into two markings. The red circle, at the late-March lows, sits near -$7.5 billion — one of the deepest short-gamma readings of the entire eight-year window. In that state, dealers were forced to buy strength and sell weakness; their hedging amplified the rebound off the lows. The green circle is now: $21.3 billion long, against a long-run average of $3.84 billion and a standard deviation of $3.54 billion. That is the upper tail of the distribution, several sigma above the mean. In six weeks the dealer book has moved from being structurally forced to chase the tape to being structurally positioned to dampen it. Both extremes are the same coin. The regime change is the flip between them — and history says the second flip rarely comes with a warning.
Figure 01 · Qualitative comparison
Two different hedging regimes
| Net dealer position | When spot rises | When spot falls |
|---|---|---|
| Long gamma | Reduce the underlying hedge | Increase the underlying hedge |
| Short gamma | Increase the underlying hedge | Reduce the underlying hedge |
Skew is telling on the crowd
Supplied archive exhibit · original labels. Read alongside the editorial corrections.
Read the bottom row first. Bottom-left, in red: QQQ 3-month call skew (25-delta call versus ATM), at the 100th percentile of the trailing year. Out-of-the-money call premium is the most expensive it has been in twelve months. Bottom-right: put skew (25-delta put versus ATM), at the 0th percentile. Protection is the cheapest it has been. The top-left composite — 25-delta put versus 25-delta call — is consequently at the 0th percentile, dragged there by the put-skew collapse, not by anything reassuring about realised risk. The crowd is paying up for upside lottery tickets and refusing to pay for downside insurance, at exactly the moment the dealer book is most extended in the opposite direction. The asymmetry between what is owned and what is hedged has rarely looked this clean.
REGIME | DEALER BEHAVIOUR | STOCK EFFECT | VOL EFFECT |
|---|---|---|---|
Net long gamma | Buys weakness, sells strength | Mean-reverting; range-bound | Suppressed (artificially low) |
Net short gamma | Buys strength, sells weakness | Trends amplified; reflexive | Elevated; gaps widen |
Gamma flip (top→bottom) | Forced to chase the move | Cascading sell-pressure | Vol regime change |
RISK
The asymmetry of a long-gamma regime is its central feature, and it is misread by most participants. When dealers are long gamma, they buy weakness and sell strength. This suppresses realised volatility. The tape feels orderly. Trends extend. But the same book that absorbs volatility on the way up reverses character at the flip level. Below it, dealers are short gamma — they must sell weakness and buy strength to stay hedged. The hedging that cushioned the move becomes the accelerant of the reversal.
A long-gamma cushion is not a floor. It is a coiled spring with the sign flipped. The boundary between the two is a single price.
Supplied archive exhibit · original labels. Read alongside the editorial corrections.
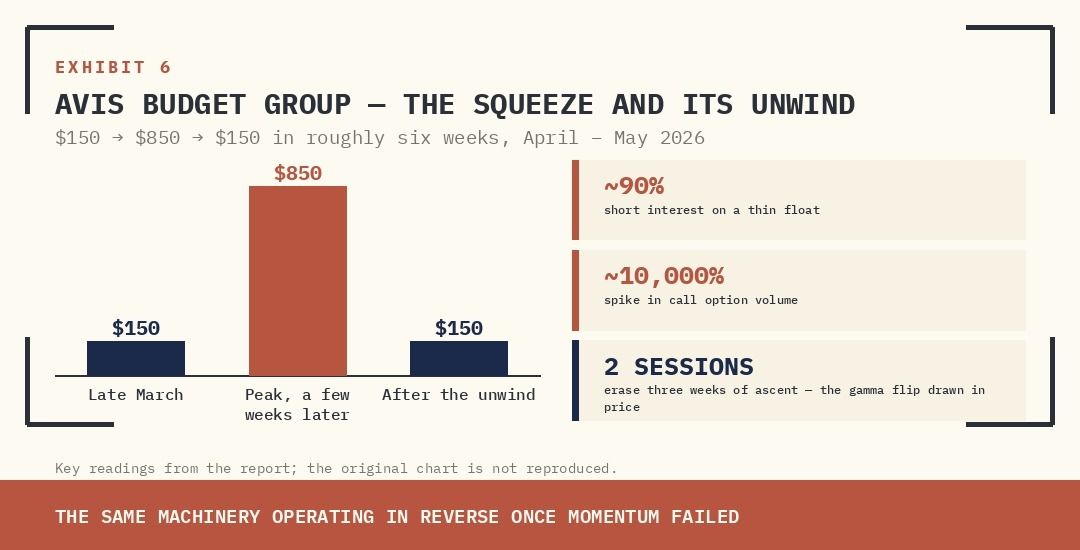
The Avis Budget episode is the cleanest recent precedent, and the chart shows why. The stock went from roughly $150 in late March to nearly $850 in a few weeks, then collapsed back to $150. The underlying business did not deliver a $700 swing in intrinsic value and then unwind it. What delivered it was a thin float, ~90% short interest, and a roughly 10,000% spike in call option volume — followed, inevitably, by the same machinery operating in reverse once momentum failed. Look at the right edge of the chart: the unwind is not a slow bleed; it is two red candles that erase three weeks of ascent in two sessions. That is the gamma flip drawn in price. The semis are not Avis Budget. The floats are deeper, the shorts are smaller. But the qualitative mechanic is identical, only diluted. Diluted does not mean absent — it means slower to ignite and slower to unwind.
There is a second-order risk worth naming. The narrative supports the trade. The trade supports the narrative. Every higher print in the AI-capex semis complex is read as confirmation of the AI capex thesis, which draws in more momentum buyers, who buy more calls, which forces more dealer hedging. Disentangling fundamental conviction from mechanical flow in this environment is nearly impossible in real time — and that is precisely what makes the position dangerous for anyone treating it as a fundamental holding.
PRICE
The price level that matters most for the index is the gamma flip. As of 11 May, the S&P 500 sits in long-gamma territory at 7,404, with the flip at approximately 7,185 (per aggregate dealer-positioning data). Above that line, dealer hedging is stabilising. Below it, dealer hedging amplifies — and the very book that has been the market's tailwind becomes its accelerant.
Supplied archive exhibit · original labels. Read alongside the editorial corrections.
The shape of the curve is the story. To the right of spot, dealer gamma is large and positive — peaking near +$120 billion per 1% move — and every step higher is mechanically dampened by sell-side hedging. As index price falls toward 7,250, the curve begins to roll over. At 7,185 it crosses zero — the gamma flip. Below that line, gamma turns sharply negative and accelerates toward roughly -$70 billion per 1% move. The cushion is finite; the cliff beneath it is not symmetric. A 220-point decline does not arrive at the same regime that a 220-point rally departs from. The asymmetry of the curve is the asymmetry of the trade — and the longer spot grinds higher above the flip, the more the right tail of that curve thickens and the less symmetric the exit becomes.
The index level is the headline number. The operative levels are the single-stock flips. Each of the AI-capex semi names, and their sector ETFs, carries its own aggregate gamma exposure, and the dispersion is wide. The names that have ripped hardest on call demand are the ones whose individual flips sit closest to spot, because dealer hedging has done a disproportionate amount of the marginal lifting. Those are also the names where a 5–7% pullback can trigger the regime change first — independent of what the index is doing.
Tape snapshot
NAME / VEHICLE | 30-DAY | YTD | READ |
|---|---|---|---|
Intel | +90% | +200%+ | Lead vehicle for the AI infrastructure squeeze |
AMD | Tracking | Strong | GPU/CPU narrative; high 0DTE flow |
Micron | Tracking | Strong | Memory leverage to the same trade |
SOXX (sector) | Parabolic | Stretched | Already pricing 2026 EPS; paying for 2027–28 |
Avis Budget (precedent) | $150→$850 | → $150 | Thin float + 90% short + ~10,000% call vol spike |
Read the table the way the dealer reads it: 30-day moves of this magnitude in mega-cap names do not happen on fundamentals. They happen because the dealer book is the marginal buyer. The exit is the same door.
POSITION
For the institutional book
- Trim semi-driven beta into mechanical strength. If the thesis is AI capex and the holding period is multi-year, the right entry is not a vertical chart; it is the unwind that follows the gamma flip. Patience here is paid for.
- Buy protection while it is cheap. With put skew at the 0th percentile and call skew at the 100th, the relative cost of downside hedges versus upside calls is at one of the more attractive points of the year. Index puts, put spreads, or put-spread-collars financed by selling the rich upside calls are all live trades.
- Do not sell premium on the names with 0DTE call mountains. Covered calls and naked call writing on these parabolic movers in this regime is a structurally short-gamma position taken at the moment of maximum reflexive risk. The premium is rich for a reason.
- Watch the single-stock flip levels, not just the index. The first names to flip will be the leaders. Treat their tape as the canary, not the validation.
For the trading book
- Define the exit before the entry. In long-gamma regimes, drawdowns are shallow and frequent — which conditions traders to add on dips. The moment that pattern breaks, the regime has changed. Pre-commit to the level.
- Lean against extreme call skew on individual names rather than the index. Single-stock skew normalises faster than index skew, and the IV crush on a failed squeeze is brutal.
- Treat 0DTE flow data as a primary input, not a footnote. The marginal price-setter in these names is intraday gamma. Real-time gamma exposure tracking is now table stakes for anyone holding short-dated risk.
Fundamentals will get the last word. They always do. The question is whether your book survives the chapters between here and there.
BOTTOM LINE
The AI infrastructure thesis is not wrong. The semiconductor cycle is real, the hyperscaler capex is real, and the operating leverage that follows is real. None of that is what is setting the print on Intel, AMD, or Micron this month. The report attributes the move partly to option-related flows, but the quoted long-gamma estimate does not establish forced buying or prove what set individual share prices. When the gamma flips — and gamma always flips — the machinery can change as net exposures change. Position for possible regime change, not against the move. The move is mechanical. The regime change will be too.