Original Lens and publication context
Record inventory draws. Dated Brent at $144. Largest synchronised supply loss since 1973. Crude futures stuck in the high-$90s. The math doesn't clear — the missing 2.3 mbd is where the next leg lives.
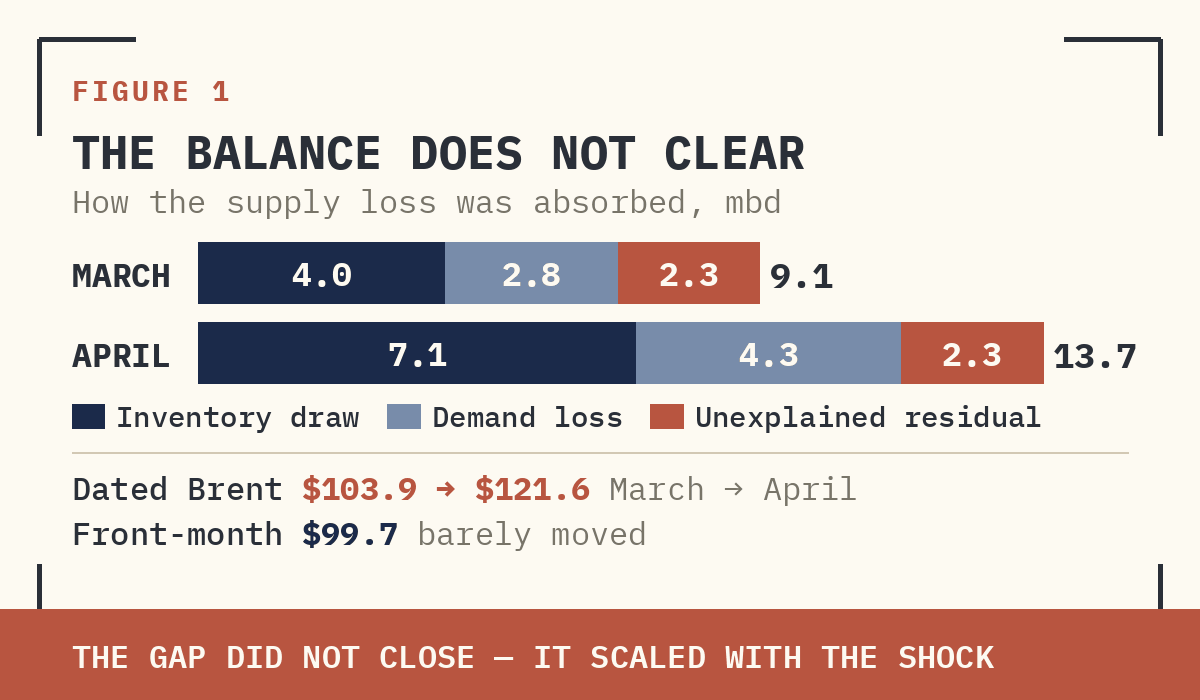
- Eight weeks in, April's supply loss is 13.7 mbd (9.1 mbd in March), inventories are drawing at a record 7.1 mbd across every stock category and forced demand loss is 4.3 mbd — above the 2009 trough of 2.5 mbd. Front-month Brent sits in the high-$90s.
- The arithmetic does not balance: a 2.3 mbd residual that neither inventories nor observed demand destruction has absorbed. Dated Brent at $121.6 — after a $144 peak on 7 April, above 2008 — sits $22 over the $99.7 front-month.
- Paper calm rests on three compressions — risk premium on ceasefire hopes, Asian destocking of March panic-buys, moderated spot buying — none reflecting physical improvement. Hormuz flows run at 2.0 mb/d, 10% of normal; Iran's exports have collapsed to 0.3 mb/d.
- The calendar: OECD stocks reach the 842 mb operational minimum in early May, when price rather than inventory takes over the balancing; Iran's forced shut-in of ~1.9 mbd begins around 20 May. The residual must come from Europe and the US, well above front-month.
- Position: physical over paper (dated Brent, prompt cracks, physical inventory); distillate cracks until Europe's buffer drains; gasoline cracks into US summer; refiners over upstream near term; US midstream with Gulf Coast export capacity. EM importer currencies and sovereign credit carry the widest tail.
KEY LEVELS AND COUNTDOWNS
Every number connects to a chart below. Dashboard of physical stress against paper calm.
MARKER | CURRENT | SIGNIFICANCE |
|---|---|---|
Supply loss (April) | 13.7 mbd | vs 9.1 mbd March; widened 4.6 mbd |
Inventory draw (April) | 7.1 mbd | Record synchronised — every stock category |
Forced demand loss (April) | 4.3 mbd | vs 2.5 mbd 2009 GFC trough |
Residual (JPM balance) | 2.3 mbd | Must clear via Europe/US demand |
Cumulative draw since war | 474 mb | All-time low trajectory |
OECD operational min | 842 mb | Reached early May |
Hormuz flows (4DMA) | 2.0 mb/d | 10% of 20 mb/d normal |
Iran exports (4DMA) | 0.3 mb/d | −2.2 mb/d vs 2025 avg |
Sanctioned (Iran+Russia) | 3.5 mb/d | −1.3 mb/d vs 2025 avg |
Dated Brent (Apr) | $121.6/bbl | 7 Apr peak: $144 (above 2008) |
Front-month Brent | $99.7/bbl | $22 physical–paper gap |
DFL spread | ~$10/bbl | Compressed from ~$40 peak |
US total oil exports | 12.7 mb/d | Record; Texas pipes at capacity |
US product exports | 8.08 mb/d | All-time high |
Iran shut-in clock | ~15 days | Full shut-in 1.9 mbd by ~20 May |
Gulf recovery (base) | 4 months | 99% by month 4 post-reopening |
Qatar LNG recovery | 3–5 years | Ras Laffan bottleneck |
THE ARITHMETIC DOES NOT BALANCE
Eight weeks in: 14 mbd of Gulf supply gone, 474 mb of visible inventory drawn, yet front-month Brent stuck high-$90s. JPM's April balance: supply loss 13.7 mbd, inventory release 7.1, demand loss 4.3 (above 2009 GFC's 2.5 mbd trough), realised front-month $99.7, dated $121.6. Bracketed red at bottom: 2.3 mbd residual — supply loss neither absorbed by inventories nor observed demand destruction. That line is the entire forward problem.
Supplied archive exhibit · original labels. Read alongside the editorial corrections.
Physical shortages are constraining actual consumption. What appears to be demand destruction is a supply loss showing up on the demand side of the ledger.
THE CONUNDRUM — WHY CRUDE ISN'T REFLECTING THE DAMAGE
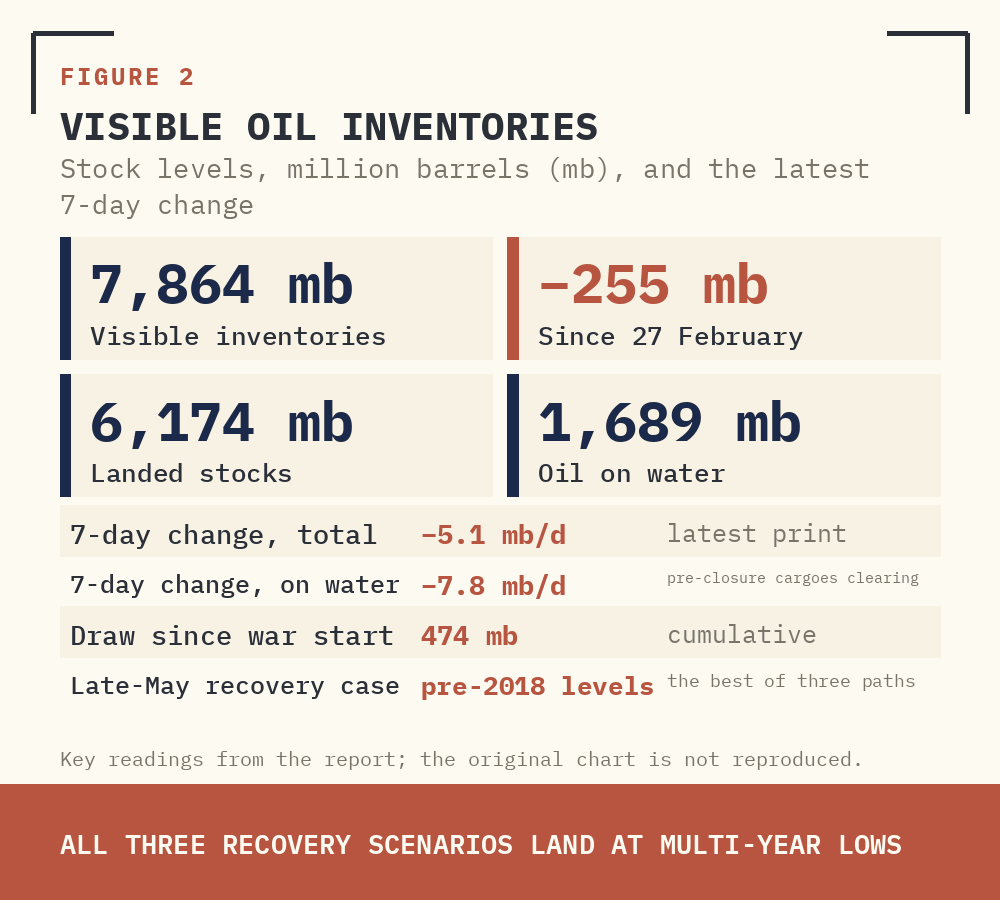
Brent high-$90s despite inventories drawing at the fastest pace since 2017, projected all-time lows even under optimistic reopening, US–Iran talks postponed indefinitely, US blockade of Iranian ports continuing. Three forces compress paper: lower risk premium as markets price in reopening; destocking ahead of it (Asian refiners, China especially, re-offering March panic-buys); moderation in spot buying as the scramble subsided. None reflects physical improvement.
Destocking isn't sustainable. Inventories have a floor — operational minimum, where pipelines and refineries lose buffer — and once reached, only price-driven demand reduction rebalances.
Supplied archive exhibit · original labels. Read alongside the editorial corrections.
The physical market is not complacent
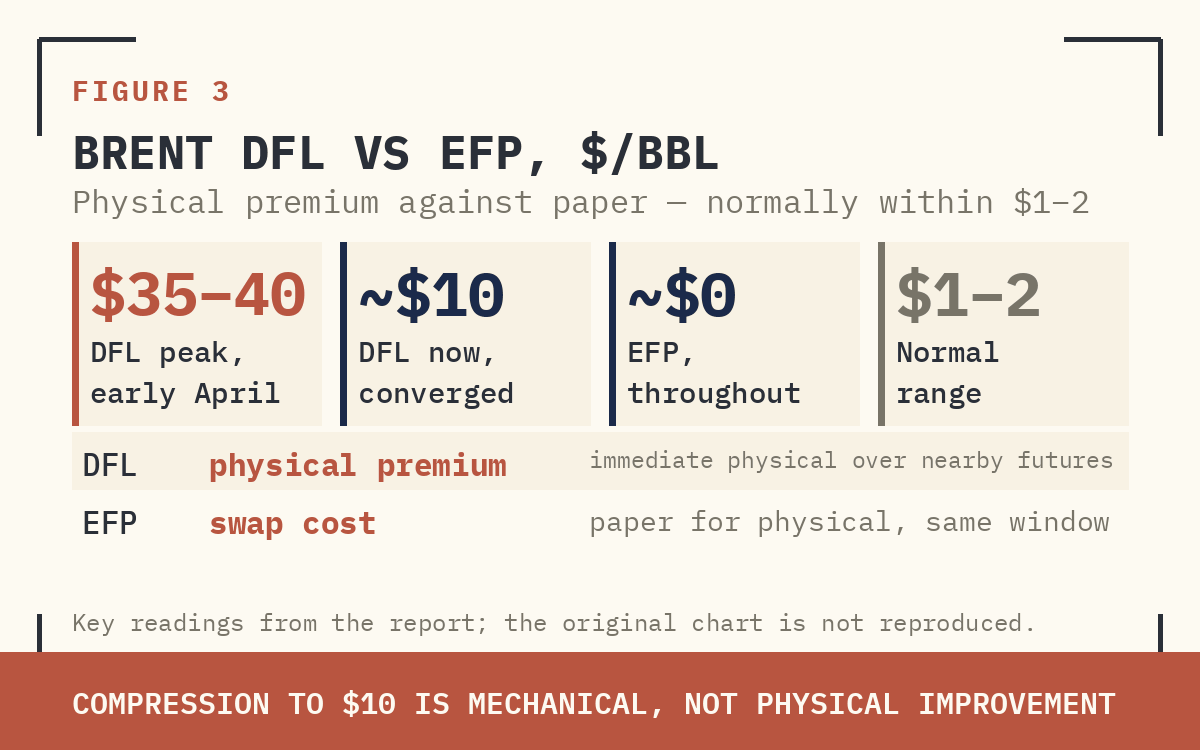
Two Brent spreads tell the real story. Normally within $1–2. EFP (cost of swapping paper for physical, same window) stayed near zero — futures pricing normalisation. DFL (premium for immediate physical over nearby futures) spiked to ~$40/bbl early April, settled to ~$10 as physical and paper windows overlapped.
Supplied archive exhibit · original labels. Read alongside the editorial corrections.
Extreme inventory draws imply tightening physical markets will continue to require much higher prices for immediate delivery rather than delivery in a few months.
THE SCALE OF THE DRAW
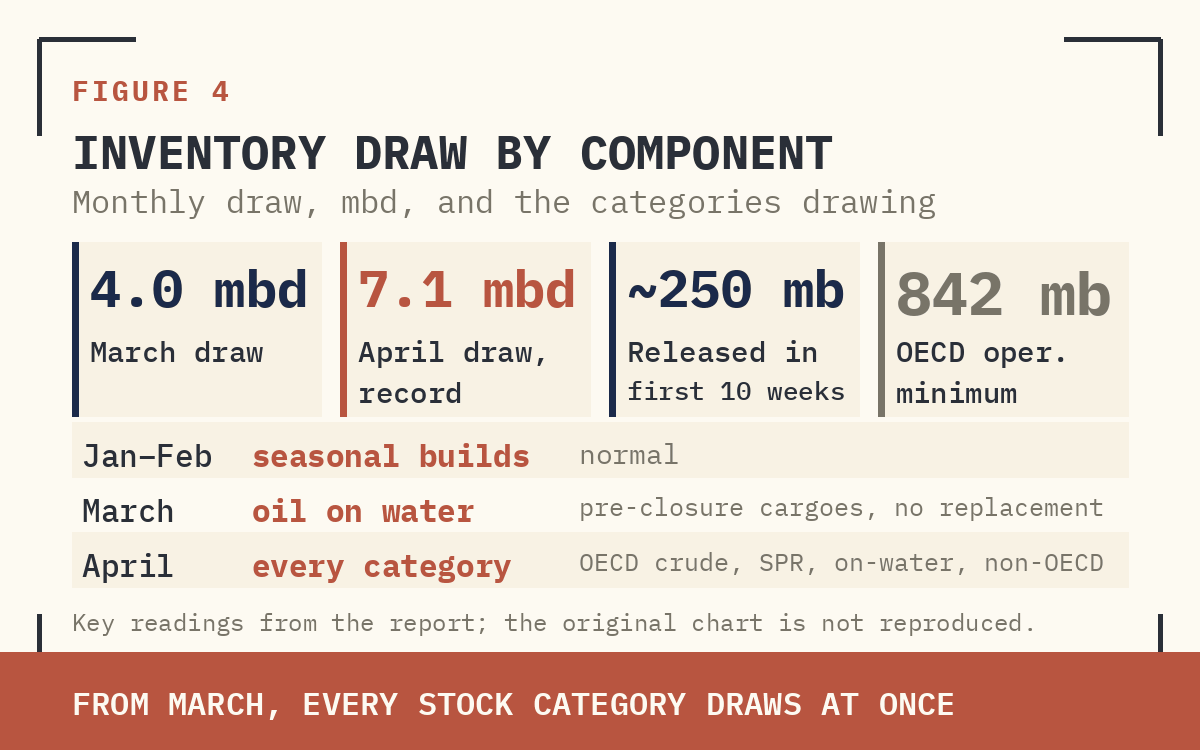
Magnitude without modern precedent. Goldman: visible inventories at 6.3 mb/d through April; total including invisible non-OECD product stocks at 10.9 mb/d — steepest monthly pace since 2017. Cumulative since war start: 474 mb. JPM's first-ten-weeks combined government, corporate, consumer releases: ~250 mb, or 6.6 mb/d. The system is draining at the physical limit of logistics.
Supplied archive exhibit · original labels. Read alongside the editorial corrections.
Composition shifted. March was mostly oil-on-water — pre-closure cargoes arriving without replacement, a one-time release. By April the draw broadened into landed commercial, SPR, and non-OECD product inventories — stocks closer to end-users, costlier to run. OECD operational minimum (~30 days forward cover, 842 mb) hits early May. Below that, inventories stop absorbing. Prices take over.
WHY THE SHOCK ABSORBER DID NOT ENGAGE
Classical balancing sequence — spare capacity first, inventories second, refinery cuts third, price-driven demand fourth — broke at stage one. Nearly all spare capacity sits in Saudi Arabia and UAE, both inside the blockade. Yanbu and Fujairah bypass terminals absorbed a portion but cannot close the gap.
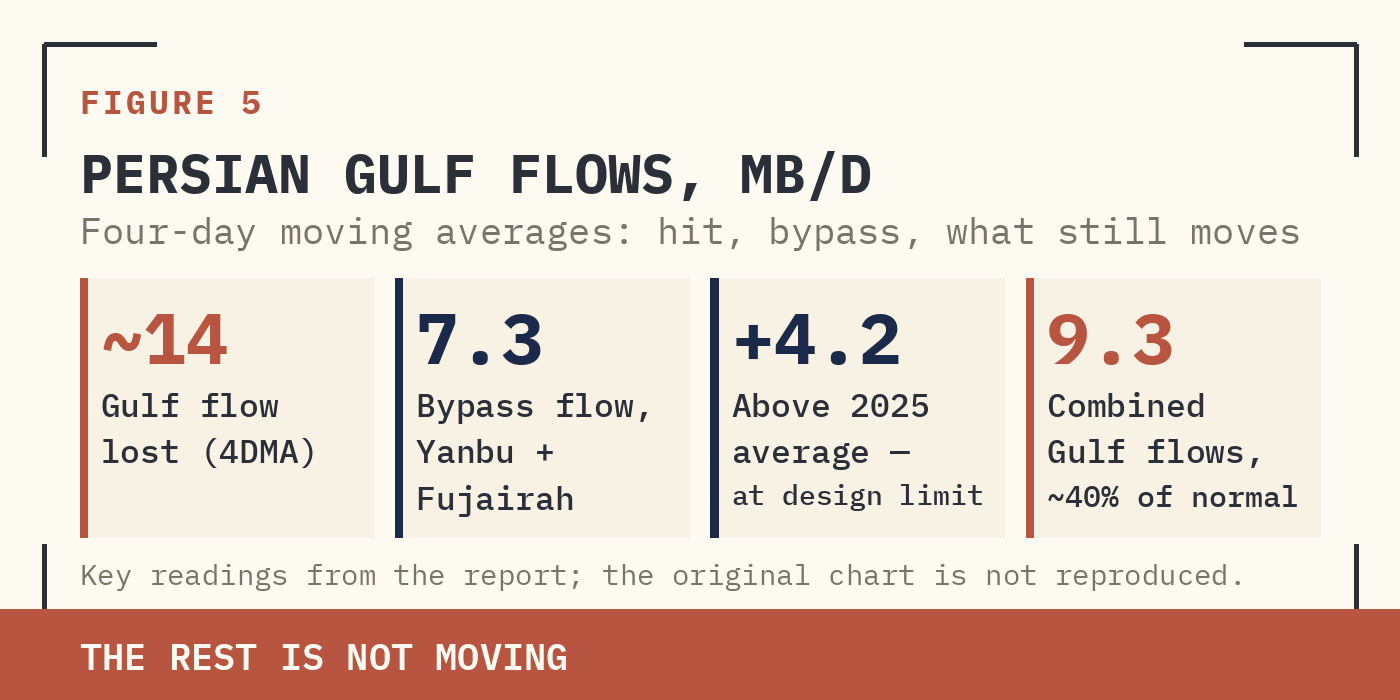
Supplied archive exhibit · original labels. Read alongside the editorial corrections.
US — marginal supplier — cannot respond fast. Shale can deliver 0.3–0.7 mbd over 3–6 months; 1.0 mbd over 6–12. Russian spare ~300 kbd, negated by 350 kbd output loss from infrastructure attacks. Stage one missing; system skipped to inventories and forced demand loss.
HORMUZ AT TEN PER CENT — THE FLOW PICTURE
Hormuz flows at ~10% of normal. 4DMA: 2.0 mb/d vs 20 mb/d pre-war baseline. Daily volatile — brief spikes to 4 mb/d when Iran permits cargoes, near-zero when it tightens or fires on vessels — but trend is flat 10%.
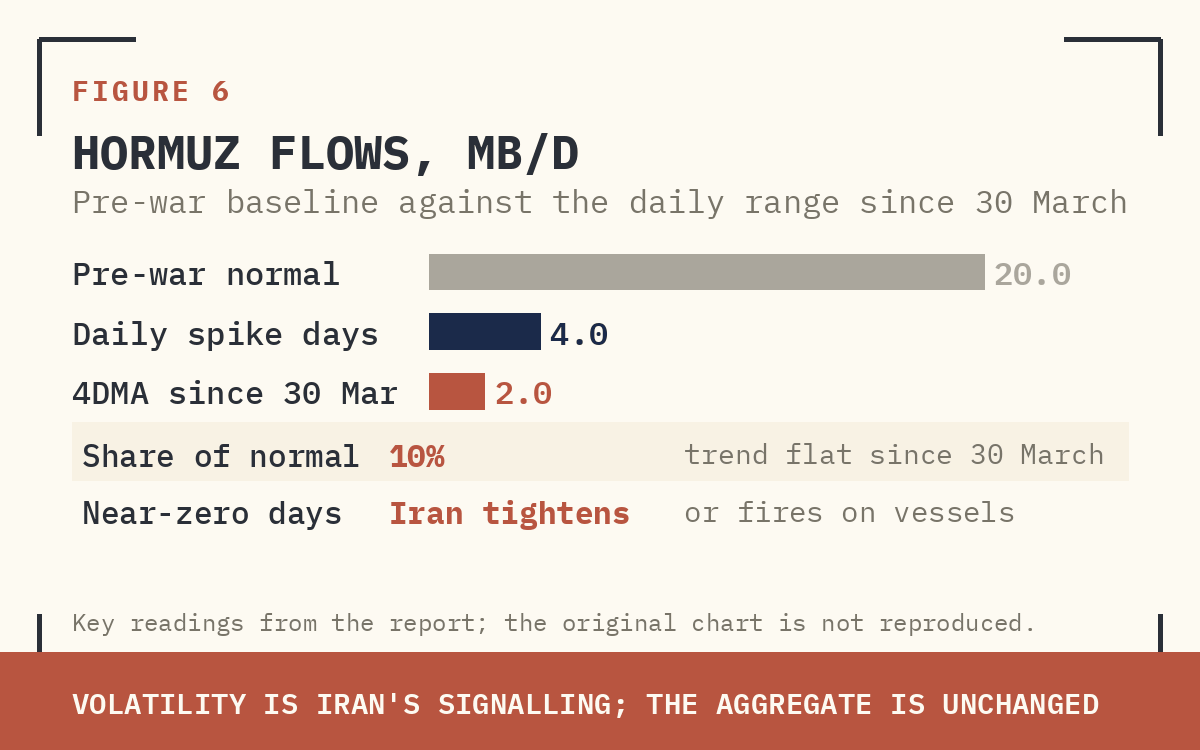
Supplied archive exhibit · original labels. Read alongside the editorial corrections.
On 12 April, US blockade on Iranian-linked vessels inverted the chokepoint dynamic onto Tehran. Iran's exports collapsed from a 2025 average of 2.5 mb/d to a 4DMA of 0.3 mb/d by 20 April — a 2.2 mb/d reduction, effectively the entire exportable volume.
Iran + Russia sanctioned flows — historically the pressure valve for discount-seeking Asian buyers — down to 3.5 mb/d 7DMA, 1.3 mb/d below 2025 avg. Iran near zero; Russia below 2025 avg as infrastructure attacks reduce exportable volume. Goldman's 2026 assumption was a 1.5 mb/d rise; actual is the opposite.
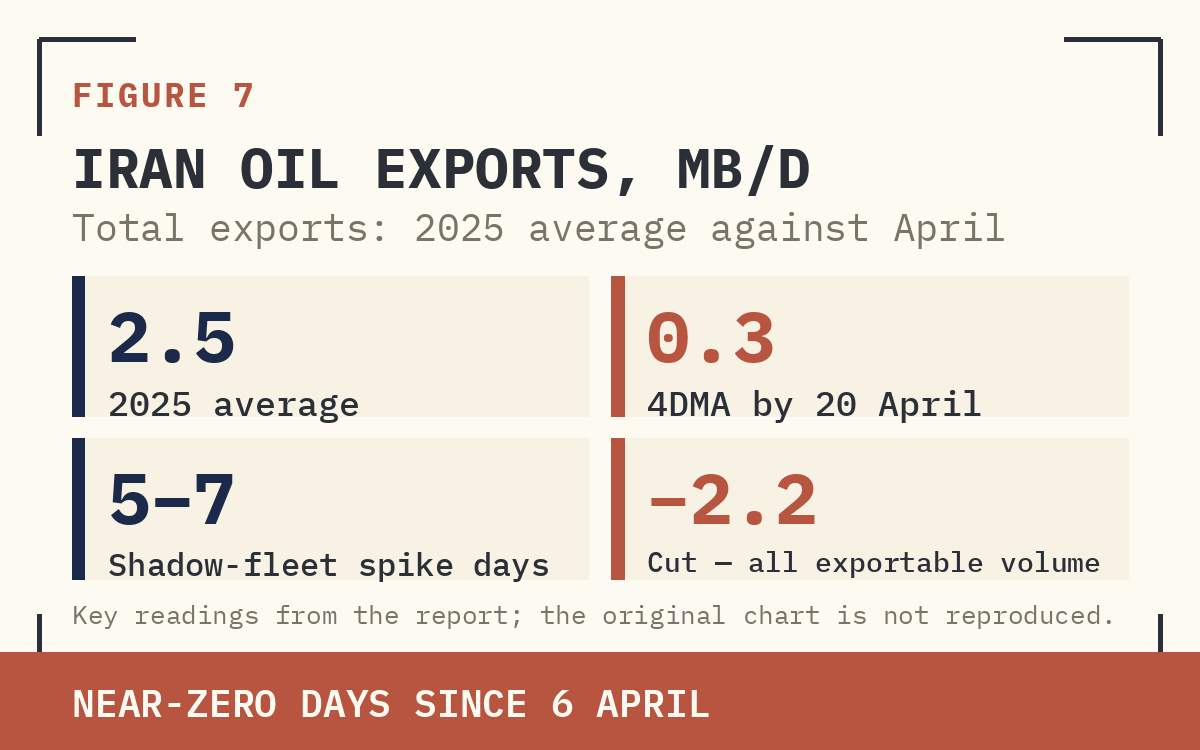 Supplied archive exhibit · original labels. Read alongside the editorial corrections. | 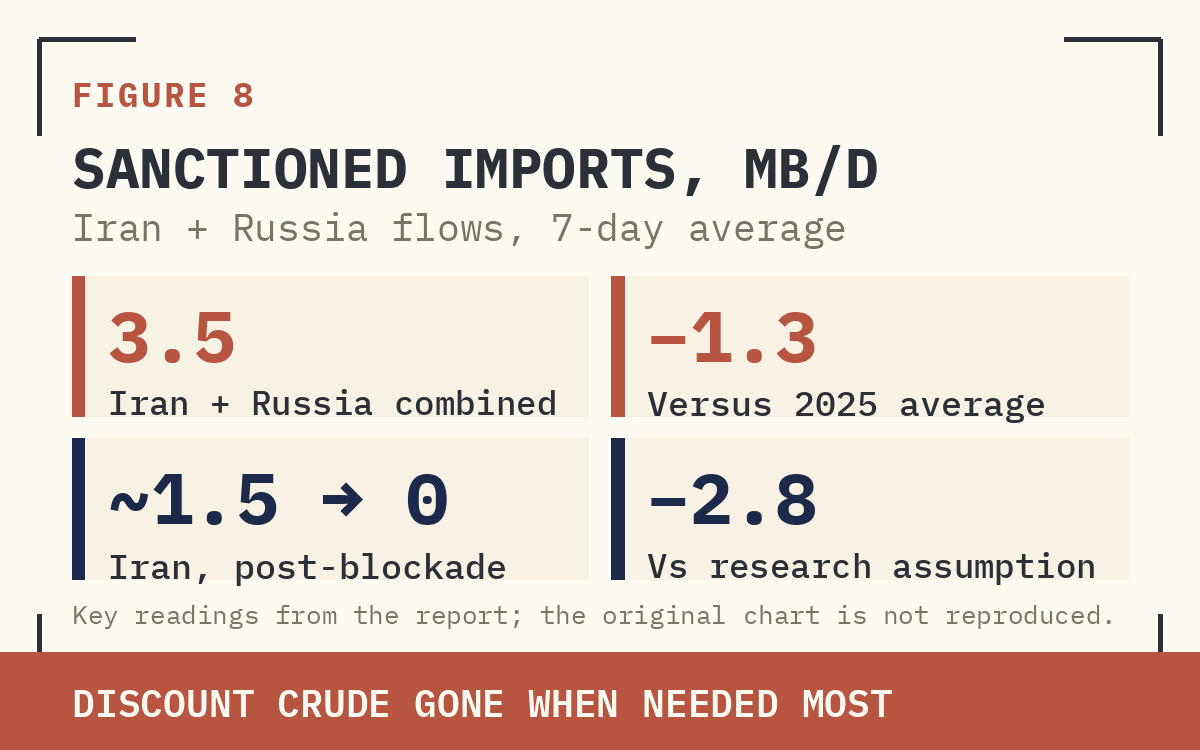 Supplied archive exhibit · original labels. Read alongside the editorial corrections. |
THE US IS TAPPED OUT AS MARGINAL SUPPLIER
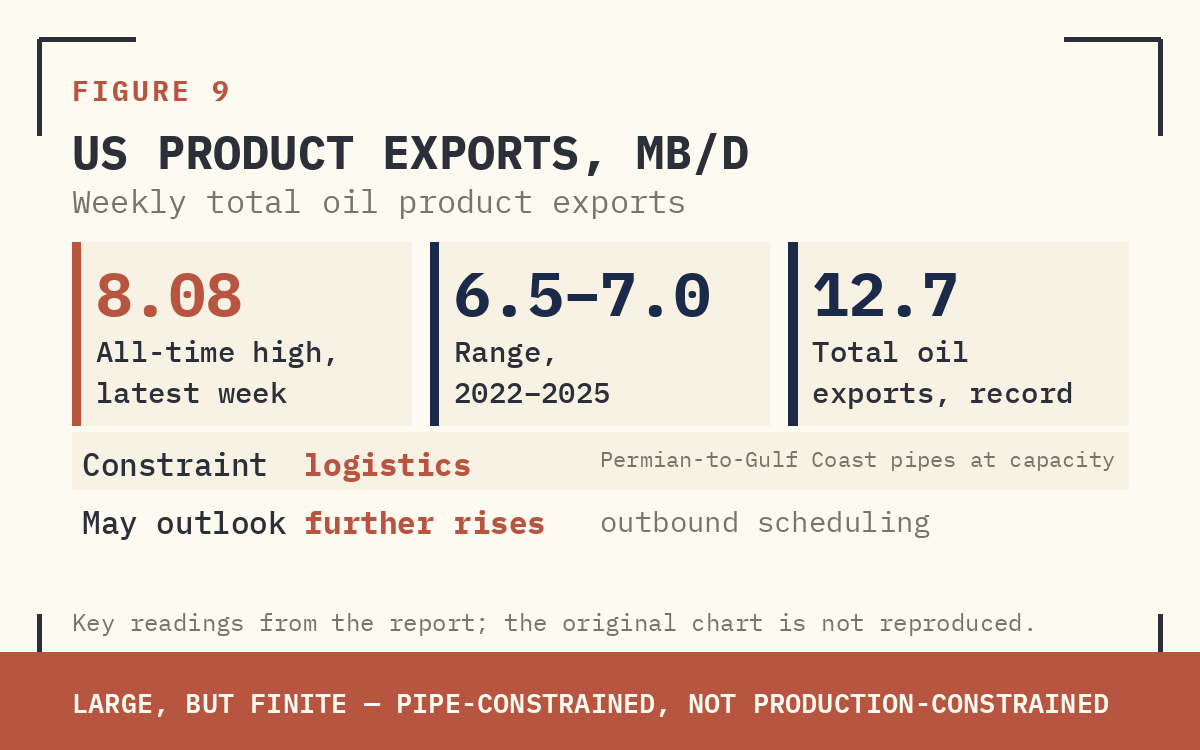
The US is doing what it can; limit is logistics, not production. Total oil exports at record 12.7 mb/d; refined product exports all-time high above 8 mb/d. Outbound scheduling suggests further rises in May. Constraint is downstream of the wellhead: Texas pipelines from Permian to Gulf Coast terminals at or above operational capacity — further exports pipe-constrained, not production-constrained. The 2.3 mbd residual cannot come from here without a multi-quarter infrastructure build-out that is not being built.
Supplied archive exhibit · original labels. Read alongside the editorial corrections.
THIS IS NOT TRADITIONAL DEMAND DESTRUCTION
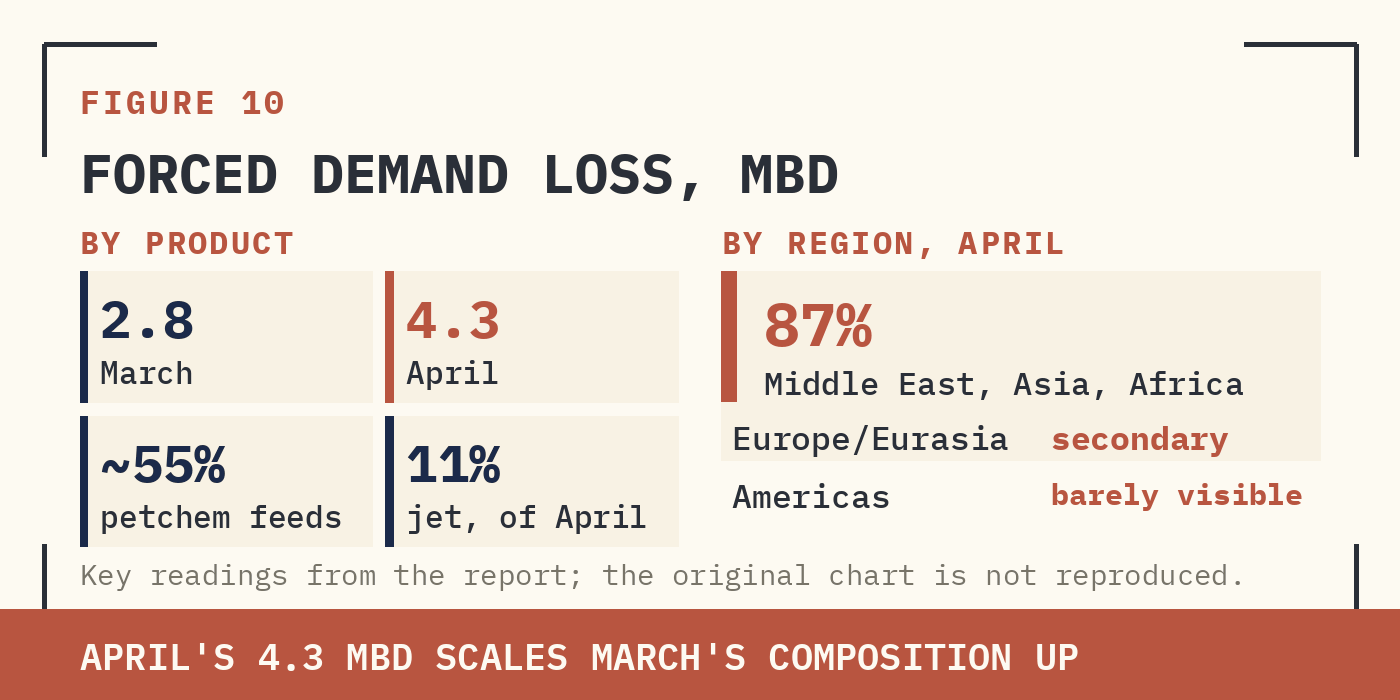
April's 4.3 mbd contraction is not price-driven. Front-month Brent averaged $99.7 — flat vs March's $99.6 — despite supply loss widening 4.6 mbd. Product prices roughly doubled, but loss magnitude far exceeds normal elasticity. This is forced demand loss from missing supply: planes grounded because jet fuel isn't at the airport; crackers idle because ethane and naphtha didn't arrive; households cut off from LPG because governments ring-fenced commercial supply. A supply loss on the demand side of the ledger.
Supplied archive exhibit · original labels. Read alongside the editorial corrections.
Petchem feedstocks = ~55% of April's loss. PDH units and steam crackers across Asia slashed rates or shut. India (60% of households cook on LPG) halted commercial LPG; March LPG consumption fell 13% YoY. Jet fuel = 11%, reflecting grounded Middle East flights. Gasoline rose far less than distillates (limited Gulf dependence), but insulation fades as refinery constraints tighten balances into US summer driving season.
THE GEOGRAPHY OF FORCED DEMAND LOSS
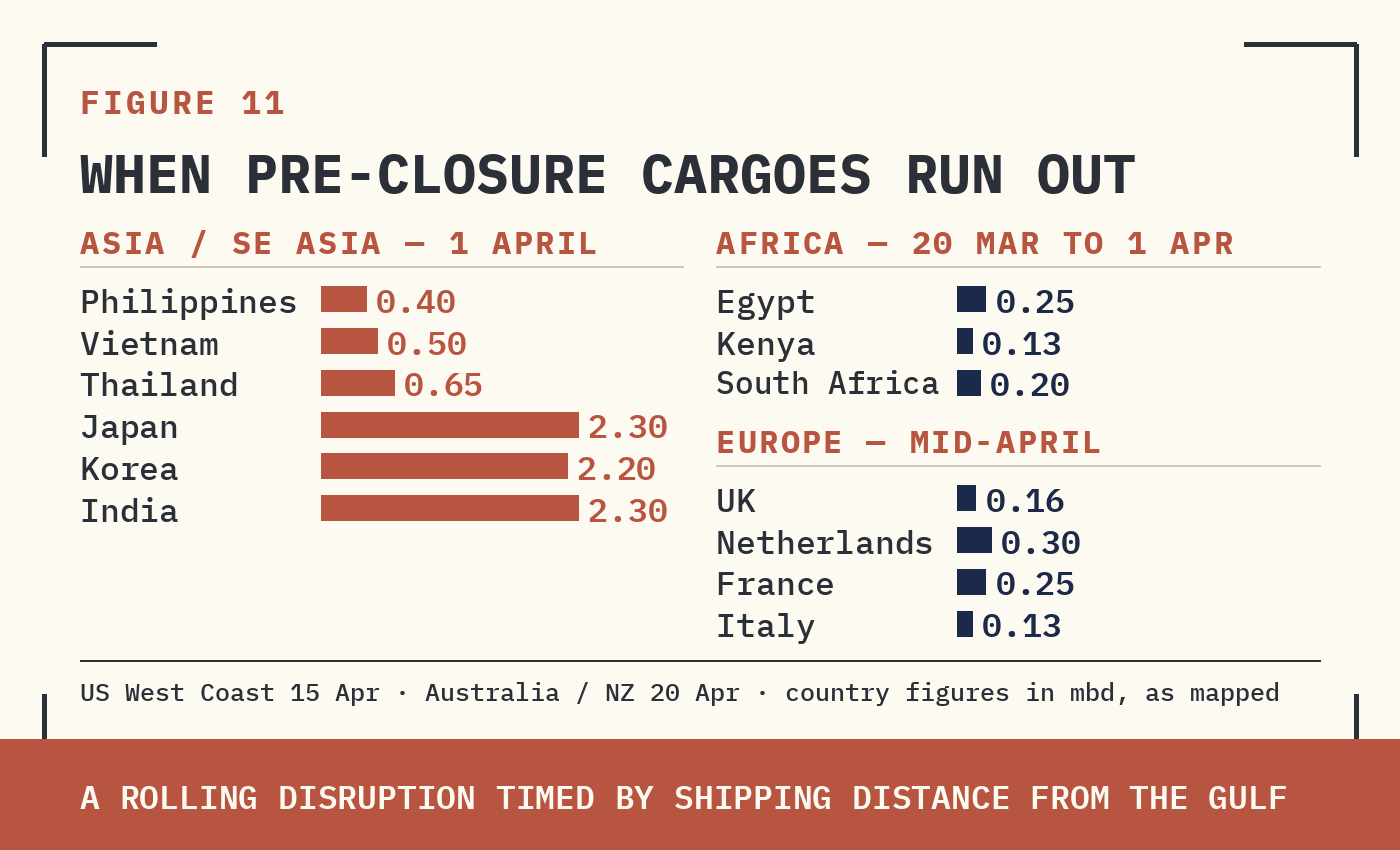
87% of April's 4.3 mbd hit is in Middle East, Asia, Africa — epicentre regions, structurally Gulf-dependent, or lacking fiscal capacity to outbid Asian buyers. Europe and the Americas have been insulated by inventory buffers and domestic flexibility. That insulation is the remaining pressure valve — and it has a calendar date.
Supplied archive exhibit · original labels. Read alongside the editorial corrections.
Country-level stress: Philippines (96% import-dependent) first to declare a national energy emergency. Indonesia, Vietnam: WFH directives, energy rationing. Thailand's fisheries (0.8% of GDP) shutting as marine fuel rose 250%. India halted commercial LPG; Mumbai 20% of hotels/restaurants closed by early March. Japan curtailed bus/ferry. Ethiopia, Zimbabwe, South Sudan, Mauritius diluting petrol. Four Italian airports rationing jet. UK's last Saudi jet 7 April. Australia (70% refining capacity lost since 2009) tapped reserves, cut fuel taxes. California's last crude 8 April.
HOW WE GOT HERE — THE SIX-PHASE THESIS
Phase 1 (mid-March) — Shut-in clock begins
Gulf shut-ins at 6.5 mbd two weeks in, tracking to 12 mbd. Shut-ins aren't quickly reversible: storage fills in hours, restart takes weeks to months. Products understood first: NWE diesel $100→$140, jet $100→$175. Airlines added fuel surcharges. South Korea imposed a fuel price cap — 1970s-style.
Phase 2 (end-March) — Shockwave moves westward
Last tanker cleared Hormuz 28 February. Flow shock became stock depletion. Voyage times set the clock: Asia 10–20 days, Europe/Africa 20–35, US Gulf Coast 35–45. A rolling disruption buffered unevenly by regional inventories (Figure 11).
Phase 3 (early April) — Operational-minimum math
OECD commercial crude: 166 mb April draw + 67 mb early-May, hitting 842 mb operational minimum. Rebuild three-stage: 6.3 mbd by week 3; 29.3 mbd by month 2 (still 3.4 below pre-war); 99% by month 4. Qatar binding — Ras Laffan damage implies 3–5 year repair for LNG and linked liquids. Iran's South Pars condensate/NGL chain carries additional tail risk.
Figure 01 · Conceptual framework
How a physical shortage travels through the market
Phase 4 (mid-April) — Shock fully plays out
Shipping stabilised at early-April levels despite a 2-week ceasefire. Iran introduced transit rules, rolled out informal IRGC toll system. US announced naval blockade. Contrary to expectations, large refinery cuts outside the Middle East didn't materialise — Asian refiners cut only 2 mbd (China 1.0, Japan 0.4, rest Singapore/Malaysia/India). Missing 13 mbd bridged by inventory draws and involuntary demand destruction. Dated Brent hit $144 on 7 April (above 2008 peak) vs front-month $109.
Phase 5 (mid-April) — Country-level stress
Policy toolkit degraded from precautionary to active rationing within 8 weeks: WFH mandates, fuel price caps, export bans, SPR releases, retail gasoline rationing, airport jet rationing, petrol dilution in parts of Africa. The 1970s policy reflex is back.
Phase 6 (22 April) — Iran's own shut-in clock begins
US blockade inverted the chokepoint dynamic onto Tehran. Iran storage: 86 mb capacity, ~54% full; working capacity ~40 mb = ~22 days of exports; four Iran-linked VLCCs in the Strait add 8 mb = 26 days. Rule: Iran cuts production after ~16 days of blackout, full shut-in of ~1.9 mbd by day 30. Cuts begin in ~15 days; full shut-in by ~20 May. Economic hit: 2 mbd of lost revenue. Strategic hit worse — aged upstream poorly suited to complete shut-in and restart, material risk of irreversible damage. Tail risk that caps normalisation speed even under political resolution.
WHAT THE NEXT LEG LOOKS LIKE
Arithmetic, not narrative. 14 mbd gone. 8 mbd covered by inventories hitting operational minimum in ~2 weeks. 4 mbd covered by forced EM demand loss. 2.3 mbd unaccounted for — and EM is saturated. Residual must come from Europe and the US, so far insulated by alternative flows, buffers, domestic flexibility. Insulation eroding: Europe tightening on distillates, Italian airports rationing jet, UK's last Saudi jet cargo 7 April; US pump prices softening driving, airfares curbing jet demand. But the price needed to force destruction in developed markets — inelastic demand, largest fiscal buffers — is well above current front-month.
Europe and the US would need to participate. For that to happen, prices would need to rise further. Perhaps much further.
Product hierarchy of the next move
Petchem feedstocks first (cracker economics deteriorate fastest). Jet next (airline capacity cuts and fare rationing). Diesel third (industrial activity, freight — most inelastic). Gasoline last, as refinery constraints spill into the broader complex. Distillate cracks stay wide until Europe's buffer exhausts; gasoline cracks widen into US summer; petchem margins compress as feedstock scarcity forces Asian rate cuts.
BUY SIDE LENS — TRIGGER, FLOW, RISK, PRICE, POSITION
Trigger
Primary: 2.3 mbd April residual. Secondary: OECD operational minimum early May shifts balancing from inventories to prices. Tertiary: Iran's forced shut-in around 20 May removes 1.9 mbd and introduces multi-year tail risk on Iranian upstream. Quaternary: expiry of the destocking impulse — once Asian refiners stop re-offering pre-closure crude, paper calm has no foundation left.
Flow
Physical Brent $22 above paper after mechanical compression. Gulf product to Europe near-stopped. Asian refiners outbidding European and African buyers. Intra-Asian trade contracting as exporters ring-fence supply. Iran+Russia sanctioned flows 1.3 mb/d below 2025 baseline. US exporting at record 12.7 mb/d, against Texas pipe capacity. Next flow shift: US West Coast, structurally isolated, optimised for heavy crude no longer reliably available.
Risk
The risk is the tail. Qatar LNG/condensate: 3–5 year repair. Iranian infrastructure may not restart cleanly. Saudi/UAE restart subject to Strait security. Even under base-case 4-month recovery, the market runs below pre-war through 2026; inventory rebuild takes 4 more months. Left tail — permanent Gulf capacity loss or an Iranian upstream that doesn't come back — is pricing in real. Right tail — sudden reopening — still needs 6–12 weeks of tanker/port normalisation.
Price
Brent futures under $100 during a 14 mbd disruption is an anomaly from three compressions — risk premium on ceasefire hopes, destocking impulse, mechanical narrowing as delivery windows converge — none reflecting physical improvement. If 2.3 mbd more destruction is needed and OECD stocks hit operational minimum without reopening, front-month must catch up to dated, which itself must rise to extract developed-market demand. The direction remains conditional on supply, inventories and demand response; the magnitude depends on elasticity and the accuracy of the balance estimates.
Position
Physical-linked exposures (dated Brent, prompt cracks, physical inventory) attractive against paper pricing normalisation. Distillate cracks asymmetric until Europe's buffer drains; gasoline cracks the vehicle into US summer; petchem margins under feedstock pressure (prefer integrated downstream). Equities: refining beats upstream beta; independents with feedstock flexibility beat integrated majors; US midstream with Gulf Coast export capacity captures the scarcity premium. FX: INR, PHP, TWD, KRW structurally pressured; real rates in importers = cleanest inflationary expression. Credit: EM sovereigns with high import dependence + limited fiscal space carry the widest tail.
POSITIONING CHECKLIST
- Physical over paper. Dated, prompt cracks, physical inventory attractive against futures pricing normalisation. $22 dated-to-futures gap is the signal.
- Distillate cracks — Europe thinning. Asymmetry intact until European jet/diesel drains. UK's last Saudi jet 7 April. Italian airports rationing.
- Gasoline cracks — enter before US summer. Refinery constraints tighten broader balances. Gasoline catches up to distillate cracks May–June.
- Petchem — feedstock squeeze. Ethane/naphtha crackers under rate-cut pressure. Prefer integrated players capturing the squeeze over pure petchem.
- Refiners over upstream (near term). Shut-in timing favours refining margins. Independents with feedstock flexibility beat integrated majors exposed to Gulf volume loss.
- US midstream — capacity scarcity premium. Texas pipes at limit = Gulf Coast export capacity is scarce. Operators with nameplate capacity capture the premium.
- EM importer FX and rates. INR, PHP, TWD, KRW structurally pressured. Real rates in importers = cleanest inflationary expression.
- EM sovereign credit tail. High import dependence + limited fiscal space = widest tail risk. Same names as in demand-loss geography.
WATCH LIST
NEXT THIRTY DAYS
DATE | EVENT | MARKET SIGNAL |
|---|---|---|
~20 April | Last pre-closure cargoes absorbed (US) | Physical premium widens |
Late April | Asian destocking impulse exhausts | Spot buying resumes → paper catches up |
Early May | OECD crude hits operational minimum | Price mechanism takes over |
Early May | Iran production cuts begin | ~0.5–1.0 mbd cumulative |
~20 May | Iran full export-volume shut-in | 1.9 mbd removed, infra tail risk |
Mid-late May | US summer driving season ramp | Gasoline crack widens |
Rolling | European jet fuel coverage | Airport rationing = destruction signal |
Rolling | US–Iran talks status | Indefinite postponement = physical tightens |
Rolling | Ceasefire/reopening headline | Dated–futures compresses; 4-month lag |
THE CLOSE
The market is in accounting balance but not economic equilibrium. The report estimates 4.3 mbd of adjustment in the most exposed regions. Further adjustment in wealthier, more buffered markets could require higher prices, but the 2.3 mbd residual is an estimate that also requires a measurement and timing check. Transmission has begun: dated Brent $121.6 vs futures $99.7 is the first tell; oil-on-water collapse is the second; OECD operational minimum in early May is the third — and most important. At that point the market stops absorbing; price takes over. Europe and the US are next, ready or not. Something is off — and it has a calendar date.