Original Lens and publication context
Goldman’s Elo-and-Poisson model makes Spain a 26% favourite. The cited market snapshot assigns Spain 16%. We rebuilt the model from its own exhibits — and priced the gap.
- Goldman’s Elo-and-Poisson model makes Spain a 26% favourite, ahead of France (19%), Argentina (14%), Brazil (8%) and England (5%). A real-money prediction market with reported turnover above $1.5 bn disagrees: France 17.1%, Spain 16.0%, England 11.5%. The disagreement, not the pick, is the story.
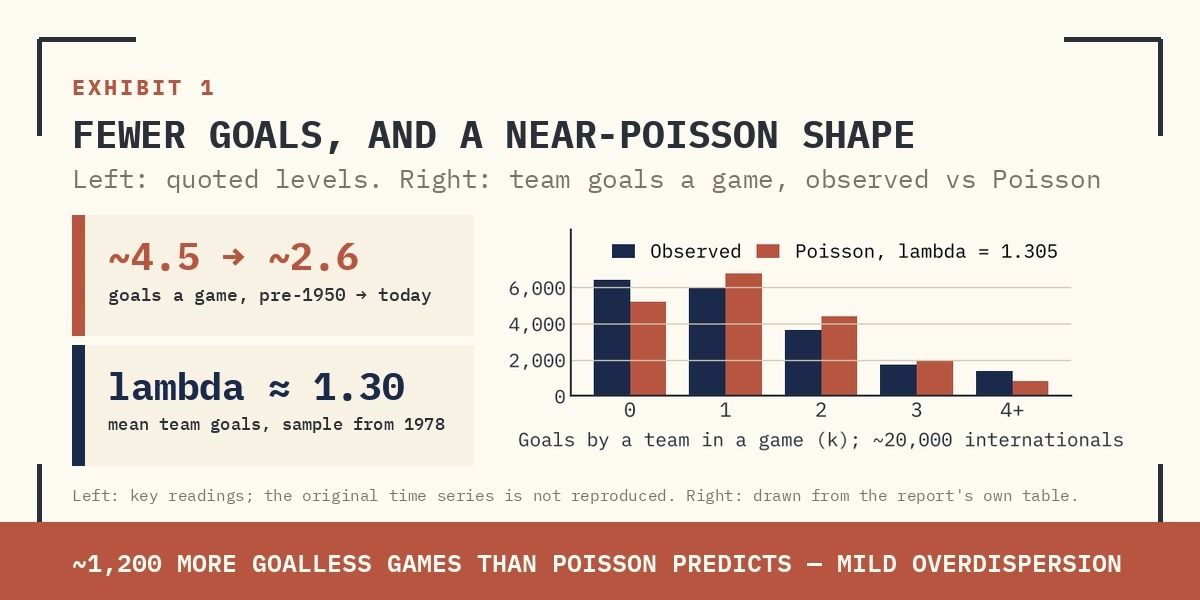
- The engine is three layers — Elo for strength, a Poisson goal regression over 20,000 internationals since 1978, Monte Carlo for the bracket. Team goals fit a Poisson with mean λ ≈ 1.30, but the data holds ~1,200 more goalless games than predicted: mild overdispersion.
- Spain’s favouritism is route as much as quality: three rounds against sub-1.0 λ opponents at 78–84% before a serious side. Chained along the modal bracket, Spain reaches ~17%; the model’s 26% is the Monte Carlo integrating every bracket — the price of path uncertainty.
- Against the market, the model’s edge is largest where the money sits: expected value if the model is right is +62.5% on Spain and +59.1% on Argentina, while England screens rich at −56.5%. Positive EV is the size of the disagreement, not a forecast.
- Positioning stays at the sector level: prediction-market and exchange infrastructure, sports media and broadcast rights (including the Indian rights layer), and consumer and advertising beta in host and high-viewership markets — sized to the model edge with fractional-Kelly discipline, never a single name.
TRIGGER
A forecast that competes with a market
Goldman Sachs has published its quadrennial World Cup forecast, and the headline is a single number: Spain, 26%, to lift the trophy on 19 July. The engine — an Elo rating fused with a Poisson goal regression over roughly 20,000 internationals since 1978 — ranks France (19%), Argentina (14%), Brazil (8%) and England (5%) behind it.
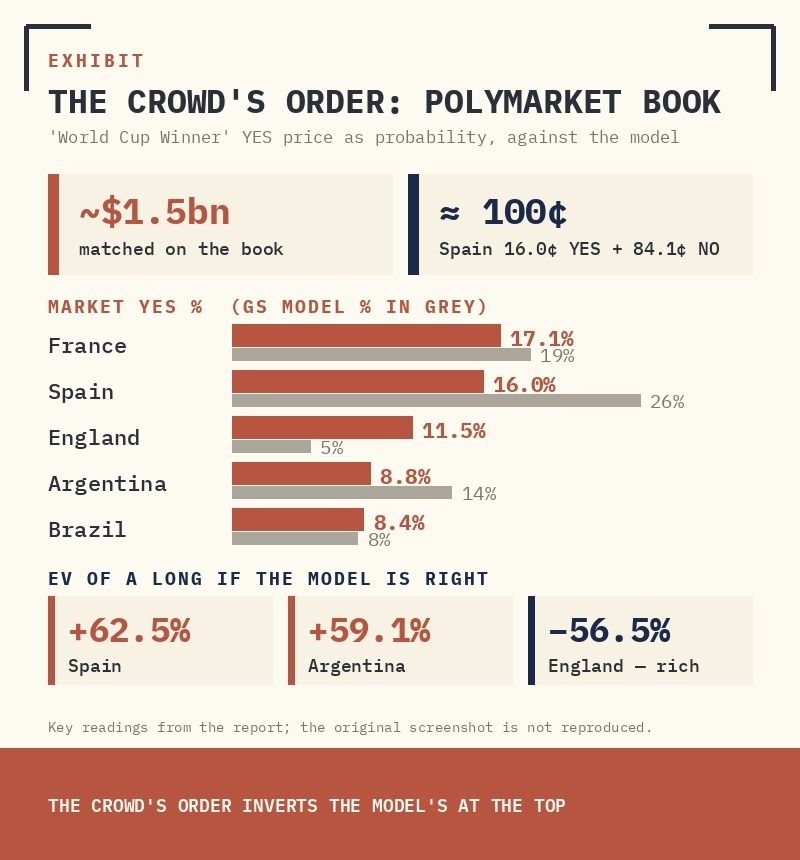
The pick is not the story. The story is that a $1.5bn Polymarket order book disagrees — France 17.1%, Spain 16.0%, England 11.5%. The desk and the crowd diverge, and they diverge most precisely where the money sits. This note rebuilds the model from its own exhibits and converts the disagreement into expected value.
The Field — Forty-eight teams, three nations, more variance
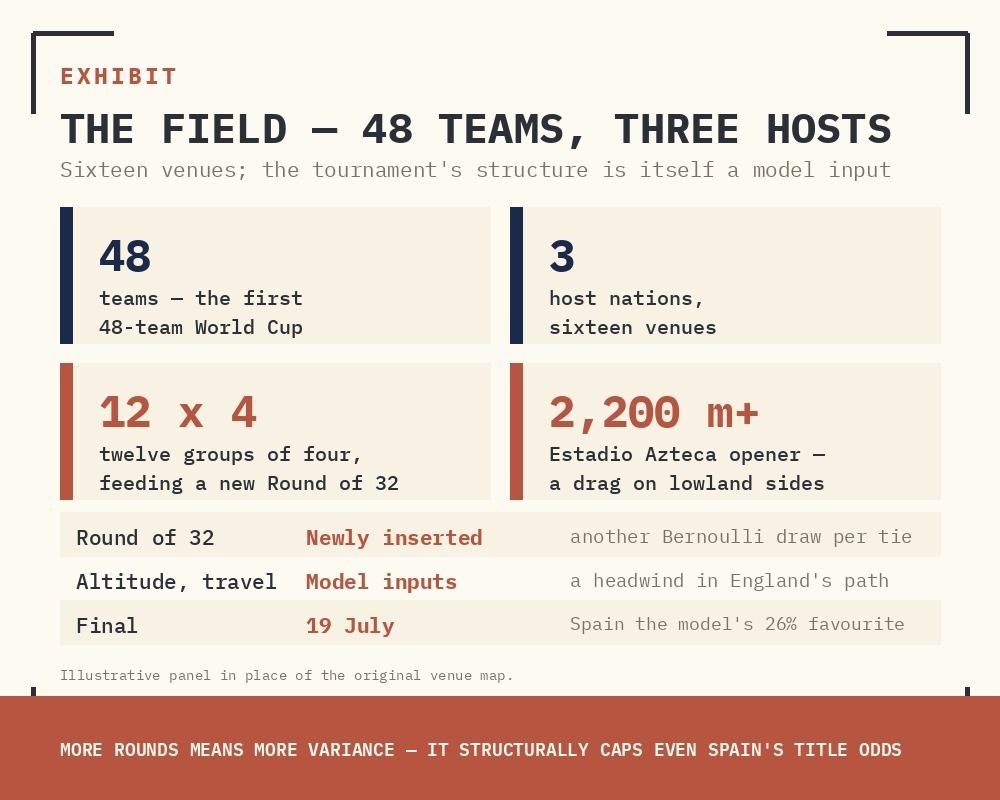
2026 is the first 48-team, three-host World Cup: twelve groups of four feeding a newly inserted Round of 32. More rounds means more variance — every extra knock-out tie is another Bernoulli draw in which a favourite can fall, which structurally caps even Spain’s title odds. Geography is a live input: the Estadio Azteca opener sits above 2,200m, a documented drag on lowland sides — and a quiet headwind in England’s projected path.
Supplied archive exhibit · original labels. Read alongside the editorial corrections.
The Model — Elo for strength, Poisson for goals, Monte Carlo for the bracket
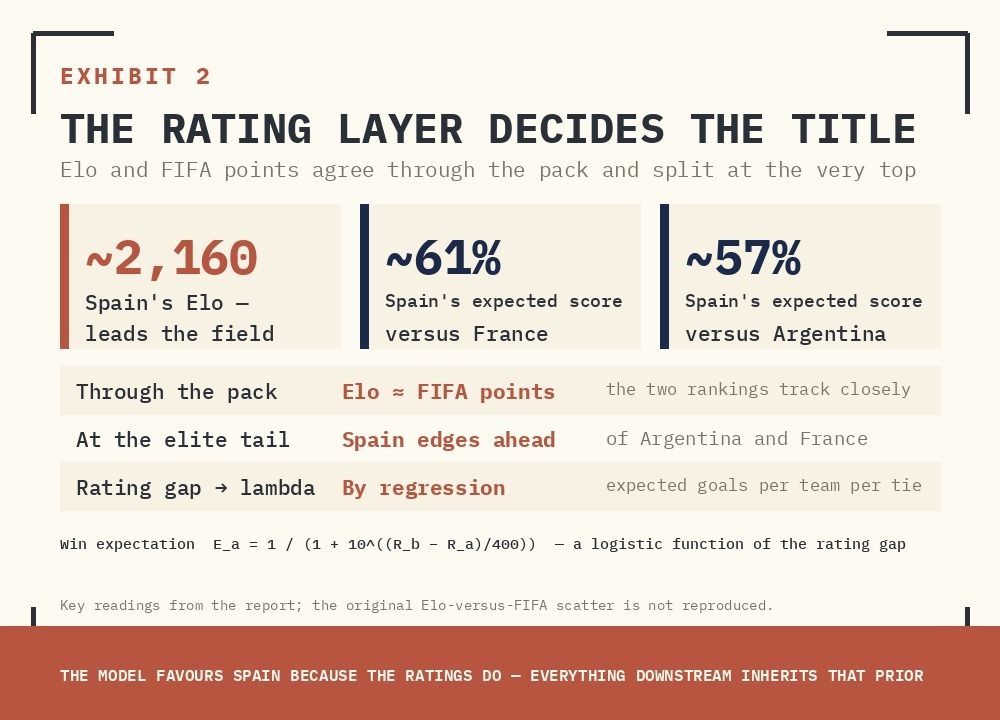
Three layers. Elo scores strength, with the win expectation between two sides a logistic function of their rating gap, . A regression converts that gap into an expected goal count — λ — for each team in each tie. Independent Poisson draws, , then simulate the full bracket thousands of times into championship odds.
Supplied archive exhibit · original labels. Read alongside the editorial corrections.
Two facts anchor the goal model. Scoring has compressed steadily — the reason the sample begins in 1978, not the high-scoring early decades. And team-level goals fit a Poisson with mean λ ≈ 1.30. Almost:
GOALS (K) | OBSERVED | POISSON (Λ=1.305) | EXCESS |
|---|---|---|---|
0 | 6,400 | 5,193 | +1,207 |
1 | 5,950 | 6,777 | −827 |
2 | 3,650 | 4,422 | −772 |
3 | 1,750 | 1,923 | −173 |
4+ | 1,400 | 834 | +566 |
The data holds ~1,200 more goalless games than a pure Poisson predicts, plus a fatter blow-out tail — mild overdispersion. Hence “broadly” Poisson; a negative-binomial would fit tighter.
The rating layer is where the title is decided. Elo and FIFA’s ranking agree through the pack and split at the very top — exactly where it matters. Spain leads on Elo (~2,160), projecting to a ~61% expected score versus France and ~57% versus Argentina. The model favours Spain because the ratings do; everything downstream inherits that prior.
Supplied archive exhibit · original labels. Read alongside the editorial corrections.
Group Stage — Favourites bank points cheaply; the mid-table draws
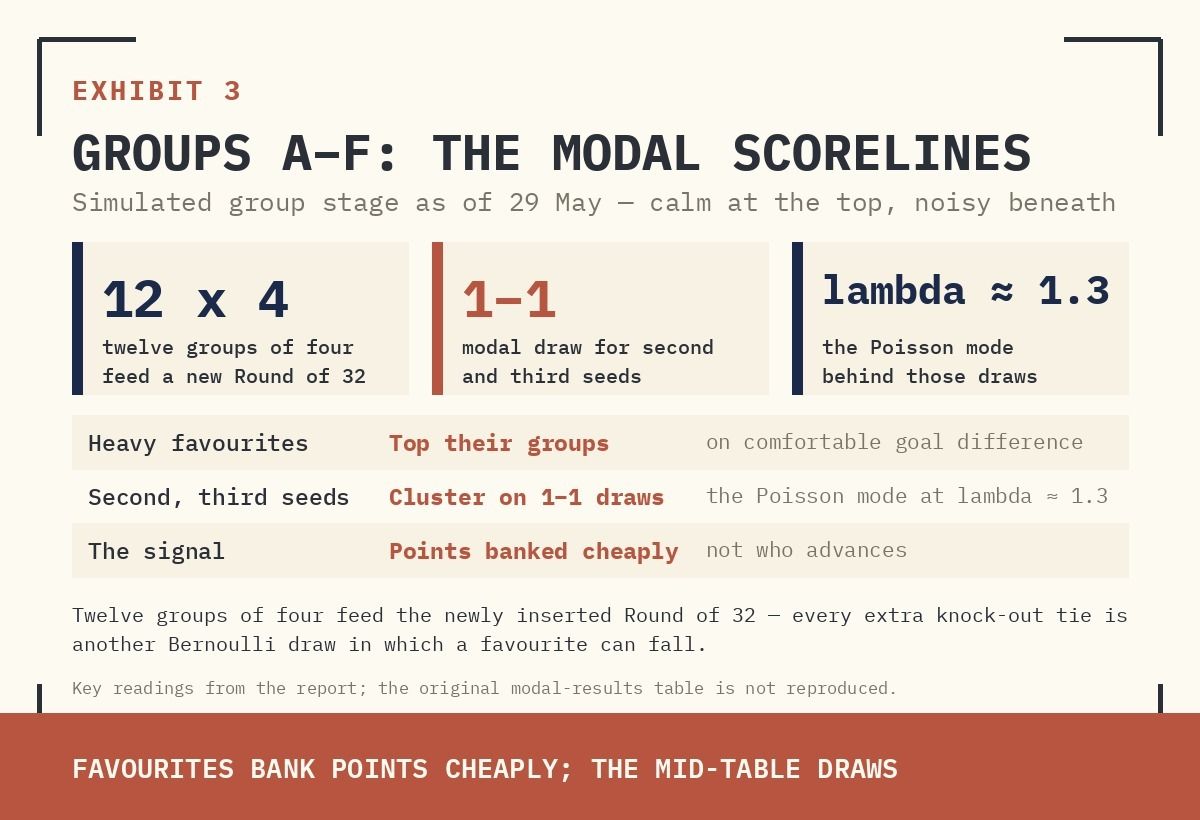
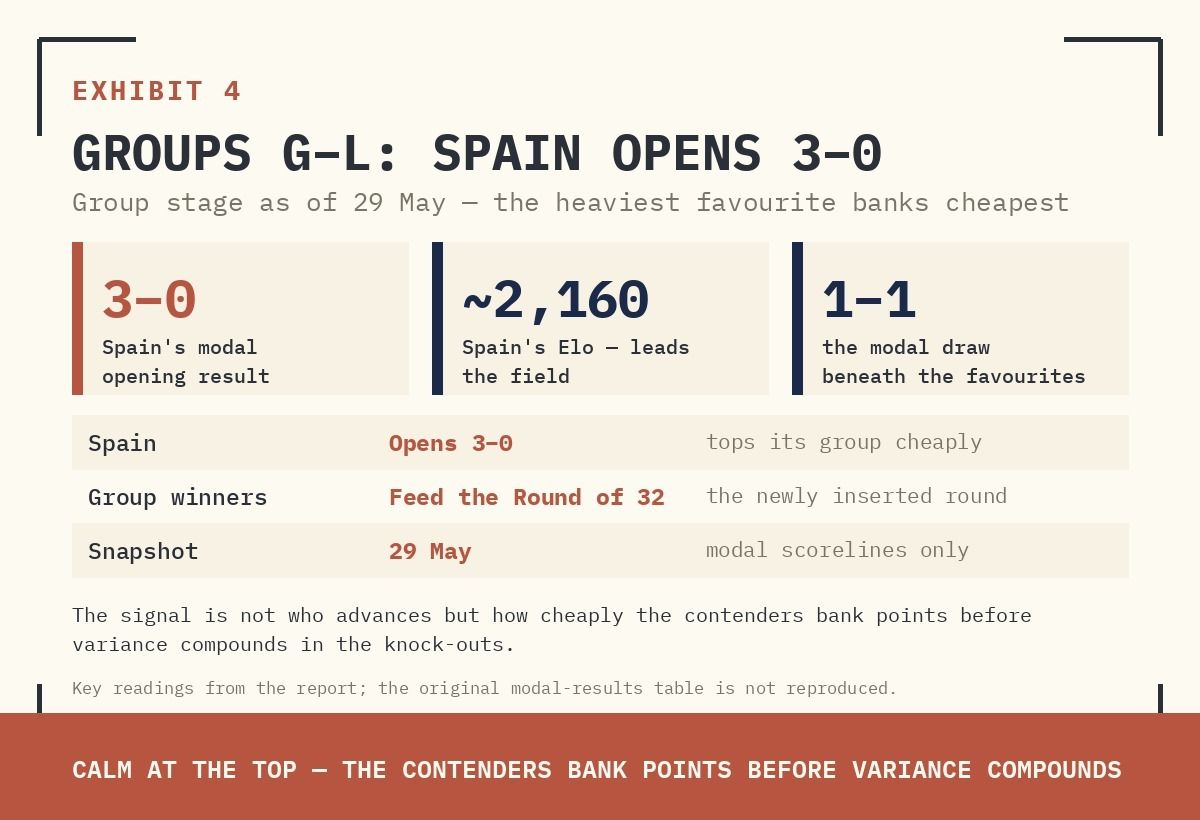
The simulated group stage (modal scorelines, 29 May) is calm at the top and noisy beneath it. Heavy favourites top their groups on comfortable goal difference; the second and third seeds cluster on 1–1 draws — the Poisson mode at λ ≈ 1.3. The signal is not who advances but how cheaply the contenders bank points before variance compounds in the knock-outs.
Supplied archive exhibit · original labels. Read alongside the editorial corrections.
Supplied archive exhibit · original labels. Read alongside the editorial corrections.
Figure 01 · Conceptual framework
How the forecast becomes a probability
The Bracket — Rebuilding the road to the winner from the model’s own λ
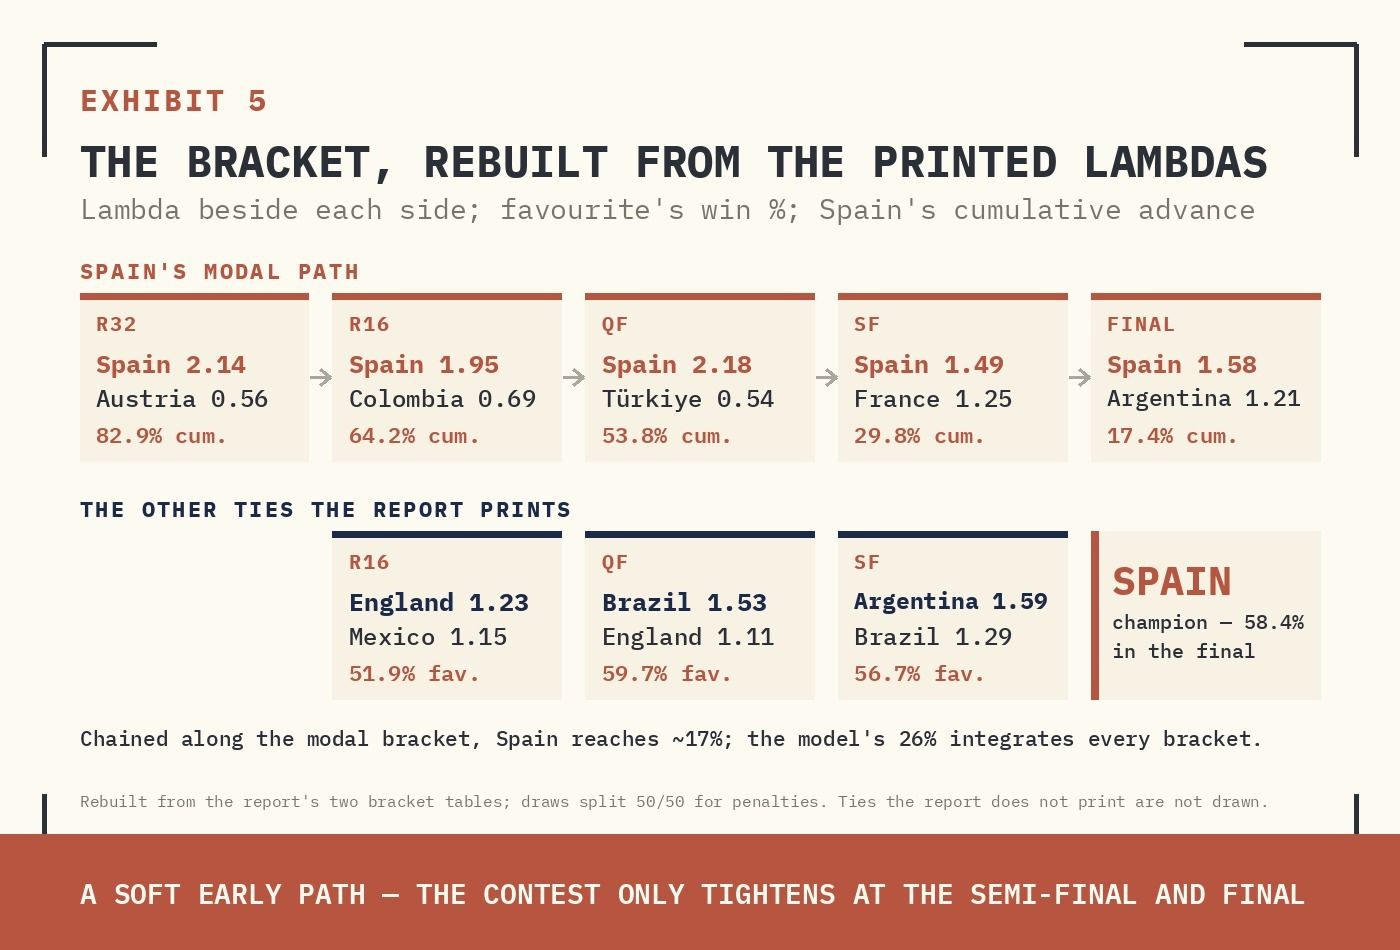
Goldman prints the predicted goals at every knock-out node — the λ inputs in plain sight. Feed them back through Poisson (draws split 50/50 for penalties) and the desk’s logic reproduces exactly, exposing where the title is actually won.
Supplied archive exhibit · original labels. Read alongside the editorial corrections.
KNOCK-OUT TIE | FAVOURITE Λ | UNDERDOG Λ | FAV. WIN % | REG. DRAW % |
|---|---|---|---|---|
Spain – Türkiye (QF) | 2.18 | 0.54 | 83.8% | 16.9% |
Brazil – England (QF) | 1.53 | 1.11 | 59.7% | 25.5% |
Spain – Argentina (Final) | 1.58 | 1.21 | 58.4% | 24.8% |
Argentina – Brazil (SF) | 1.59 | 1.29 | 56.7% | 24.6% |
Spain – France (SF) | 1.49 | 1.25 | 55.5% | 25.4% |
England – Mexico (R16) | 1.23 | 1.15 | 51.9% | 27.8% |
Spain’s edge is a soft early path; the contest only tightens at the semi-final and final, where the probabilities collapse toward coin-flips.
Spain’s favouritism is route as much as quality. It draws sub-1.0 λ opponents — Austria, Colombia, Türkiye — banking three rounds at 78–84% before meeting a serious side. Chaining the per-round probabilities along the modal bracket:
ROUND | OPPONENT | SPAIN Λ | OPP Λ | ADVANCE (CUM.) |
|---|---|---|---|---|
R32 | Austria | 2.14 | 0.56 | 82.9% |
R16 | Colombia | 1.95 | 0.69 | 64.2% |
QF | Türkiye | 2.18 | 0.54 | 53.8% |
SF | France | 1.49 | 1.25 | 29.8% |
Final | Argentina | 1.58 | 1.21 | 17.4% |
A deterministic bracket gives Spain ~17%. Goldman’s 26% is higher because Monte Carlo integrates every bracket, not just the modal one — the gap is the price of path uncertainty.
The also-rans fall out cleanly. England hits a coin-flip Round-of-16 against high-altitude Mexico (51.9%), then a 40% quarter-final against Brazil — ~16% to even reach the semis. Argentina carries the “winner’s slump” penalty, the documented underperformance of reigning champions. France is modelled to lose a 44.5% semi-final to Spain.
FLOW
Prediction markets are now price-setting infrastructure
For three cycles the Goldman note had no liquid rival; it was the reference probability. This one lands beside a real-money book turning over more than $1.5bn, with tens of millions on each contender. That is the structural shift: prediction markets are now information infrastructure, triangulated by institutional desks the way they treat a curve-implied probability.
Supplied archive exhibit · original labels. Read alongside the editorial corrections.
The model is a 29 May snapshot. The book is a live tape. Where they disagree, the disagreement is the asset.
PRICE
The disagreement, converted to expected value
Treat each Polymarket YES price as the market’s probability and each Goldman figure as a candidate truth. The expected value of a long is :
SIDE | GS MODEL | MARKET (YES) | PAYOUT | EDGE | EV IF GS RIGHT |
|---|---|---|---|---|---|
Spain | 26% | 16.0% | 6.25x | +10.0pp | +62.5% |
Argentina | 14% | 8.8% | 11.36x | +5.2pp | +59.1% |
France | 19% | 17.1% | 5.85x | +1.9pp | +11.1% |
Brazil | 8% | 8.4% | 11.90x | −0.4pp | −4.8% |
England | 5% | 11.5% | 8.70x | −6.5pp | −56.5% |
Positive EV is conditional on trusting the model over the market — it is the size of the disagreement, not a forecast. Binary pricing keeps the venue near-fair (Spain 16.0¢ YES + 84.1¢ NO ≈ 100¢).
Two trades dominate. Spain and Argentina screen cheap (+62%, +59%) — the model assigns them more than the market does. England screens rich (−57%): the crowd prices it at over double the model’s 5%. France is the consensus anchor where nothing is at stake. It is a textbook favourite–longshot split — the model stacks probability at the top, the market spreads it down the bracket.
RISK
A model output is not a market price
Three caveats. The Elo–Poisson engine is backward-looking — calibrated to history, not this bracket, and carrying the overdispersion above. It embeds judgement: the winner’s-slump and altitude overlays are defensible, but they are calls, not data. And Poisson independence understates tail correlation in cagey knock-out ties. The trap is mistaking a clean model number for a price.
POSITION
Trade the structure, not the score
A framework read, not a single-name call. Positioning stays at the sector level:
Prediction-market and exchange infrastructure. A $1.5bn single-event book confirms a secular flow into real-money probability venues; exposure to listed market-infrastructure and exchange-adjacent cohorts captures the adoption regardless of the winner.
Sports media and broadcast rights. The largest broadcast inventory in the event’s history — including the Indian rights layer, a live repricing theme — carries the realised engagement upside irrespective of the bracket.
Consumer and advertising beta. Tournament windows lift consumer-discretionary and ad-spend cohorts in host and high-viewership markets. Size to conviction in the model edge, not the favourite — a fractional-Kelly discipline at the sector level, never a single name.
The only mispricing the note surfaces is its own disagreement with the market. Disagreement, not the favourite, is the position.