
Original Lens and publication context
Hormuz shock, persistent backwardation, and India's equity reckoning
- The five-day pause in US strikes took Brent down about 10% to just under $100: relief, not normalization. More than 40 energy assets across nine Middle Eastern countries are severely damaged, and Goldman Sachs has raised its 2026 Brent forecast to $85.
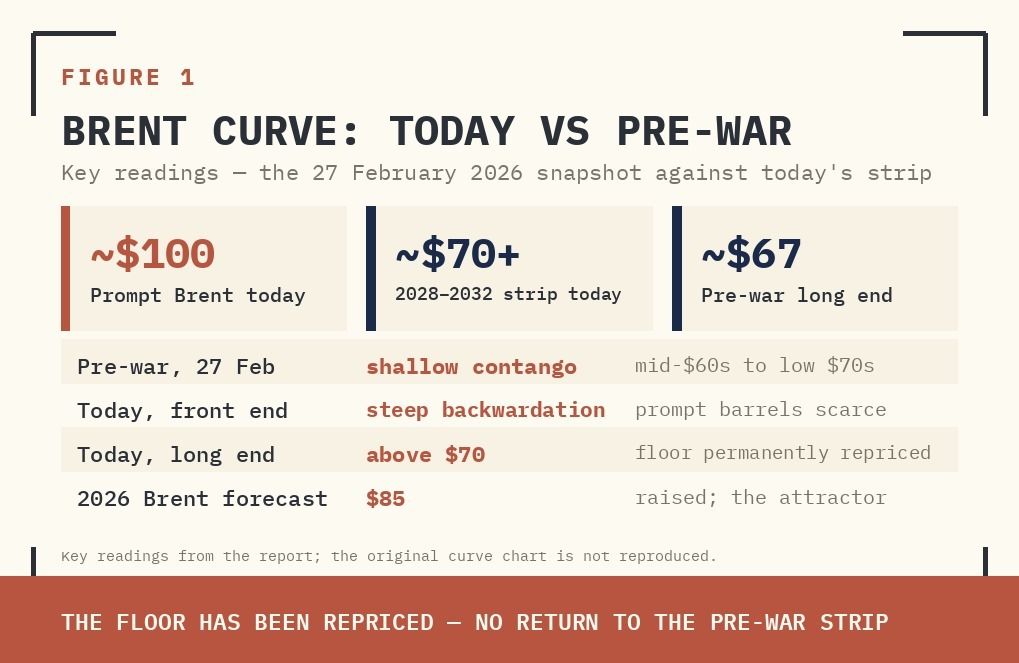
- The futures curve is the honest signal: pre-war, shallow contango in the mid-$60s to low $70s; today the prompt is near $100 in steep backwardation and the 2028–2032 strip flattens around $70, above the pre-war long end near $67. The floor has been repriced.
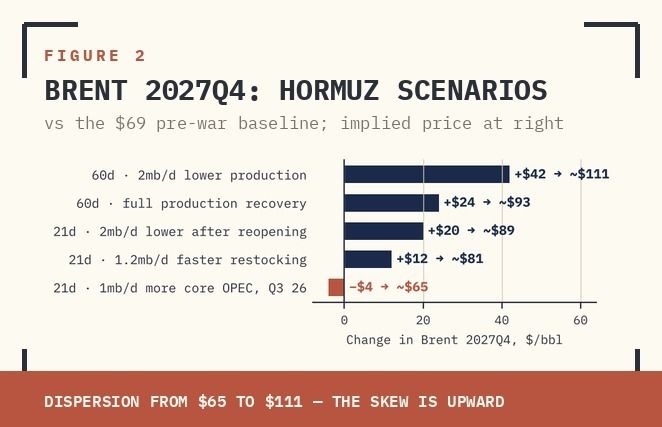
- Goldman's Brent 2027Q4 scenarios run from $65 to $111 against a $69 pre-war baseline: a 60-day disruption with 2mb/d of lost Mideast production adds $42, full recovery adds $24, and only 1mb/d more core OPEC output turns the delta negative. The skew is upward.
- India imports 85–88% of its crude; every $10/bbl costs $14–15 billion a year. At Goldman's $85–90 base case the current account deficit could breach 3% of GDP and CPI run 5.5–6.0%; at $95–100 the RBI tilts to tightening into a growth slowdown, the stagflation trap.
- The Nifty's range has shifted lower: a 12-month base case of 21,500–22,500 if oil holds above $85, with the 60-day tail testing 19,500–20,000. Exposed-sector earnings compress 8–12%; favour IT and upstream energy, underweight aviation and OMCs, reduce banks, and hedge into relief rallies.
TRIGGER
THE WAR PREMIUM THAT WILL NOT UNWIND
The five-day pause on US escalatory strikes delivered a clean experiment: Brent fell roughly 10% to just under $100 and WTI dropped into the high $80s. The market called it relief. It was not normalization. The distinction matters enormously for positioning.
A relief rally compresses risk premia temporarily while the structural damage persists beneath the surface. Hormuz traffic has not resumed normally, damaged production assets have not been repaired, and the inventory drawdowns driven by the disruption have not been replenished. When the cease-fire premium fades — as it invariably does — the market reverts to the underlying supply reality, not to the pre-war baseline.
Relief compresses the risk premium. It does not repair the infrastructure, rebuild inventories, or restore tanker-owner confidence. The floor moves up.
The International Energy Agency has assessed that more than 40 energy assets across nine Middle Eastern countries have been severely damaged — covering not just oil and gas, but petrochemicals, fertilizers, sulfur, and helium. These are supply chains with long restart timelines. Even if a diplomatic resolution opens the Strait tomorrow, oil field restart, refinery re-commissioning, and pipeline re-pressurisation each carry lead times measured in weeks to months. Tanker owners will not rush back on day one.
Goldman Sachs has raised its 2026 Brent forecast to $85, reflecting a structurally higher equilibrium driven by three reinforcing factors: commercial inventories taking a significant hit during the disruption period; governments globally likely to rebuild strategic petroleum reserves more aggressively than before; and OPEC spare capacity appearing less reassuring when it is geographically concentrated in one vulnerable corridor.
FLOW
WHAT THE FUTURES CURVE IS SIGNALLING
The Brent futures term structure is the most honest macro signal in the room right now. The chart below places the current curve against the pre-war snapshot of 27 February 2026. The gap is decisive and the shape is instructive.
Supplied archive exhibit · original publication context.
The pre-war curve sat in a shallow contango anchored around the mid-$60s to low $70s across the forward strip — a market pricing moderate global demand, comfortable OPEC supply management, and no acute geopolitical risk premium. The current curve is an entirely different animal. The prompt end is sharply elevated — near $100 — and the term structure slopes steeply downward through the medium dates before flattening in the 2028–2032 range around $70. This is steep backwardation.
Steep backwardation screams near-term physical panic. The long end above $70 tells you the market does not expect a clean return to the pre-war world either.
Steep backwardation has two simultaneous messages. First, physical buyers are paying a premium for immediate delivery because prompt barrels are scarce — the spot market is in genuine stress. Second, the long end of the current curve (~$70+) sitting materially above the pre-war long-end (~$67) tells you that the market has permanently repriced the floor. There is no scenario in the futures strip that returns to the pre-February 2026 equilibrium. The market has structurally recalibrated.
For a macro practitioner, this configuration means: (1) the near-term inflation impulse is real and severe; (2) the long-run inflation impulse is moderate but persistent — it does not vanish post-conflict; and (3) any sustained relief rally that brings prompt prices below the $85 Goldman forecast should be treated as a tactical entry for re-hedging, not as evidence of normalization.
RISK
GS SCENARIO MATRIX: PRICING THE RESIDUAL SHOCK
Goldman Sachs has published a rigorous scenario matrix estimating the impact on Brent 2027Q4 prices under varying Hormuz disruption and recovery assumptions. The baseline reference point is GS's pre-war forecast of $69/bbl for Brent 2027Q4. The disruption scenarios range from 21-day to 60-day flow interruptions, with different production loss and recovery path assumptions.
Supplied archive exhibit · original publication context.
The numbers deserve careful reading. Under a 60-day disruption with 2mb/d lower Mideast production after reopening, the impact is +$42/bbl — implying a 2027Q4 Brent price of ~$111. Even with full production recovery, the disruption cost is +$24/bbl, pointing to ~$93 in 2027Q4. The 21-day scenarios are more moderate but still material: +$20/bbl on production loss, +$12/bbl with faster strategic restocking. Only one scenario — 1mb/d higher core OPEC production from Q3 2026 — yields a negative delta of -$4/bbl, a modest offset that does not change the directional picture.
SCENARIO | DURATION | 2027Q4 DELTA ($/BBL) | IMPLIED PRICE |
|---|---|---|---|
2mb/d Lower Production + Full Recovery | 60 Days | +$42 | ~$111 |
Full Production Recovery | 60 Days | +$24 | ~$93 |
2mb/d Lower Production After Reopening | 21 Days | +$20 | ~$89 |
1.2mb/d Faster Strategic Restocking from Q3 2026 | 21 Days | +$12 | ~$81 |
1mb/d Higher Core OPEC Production from Q3 2026 | 21 Days | −$4 | ~$65 |
The dispersion across scenarios is wide — from $65 to $111 for a single futures contract date. This is not a market where mean-reversion to a single point estimate is a viable analytical framework. The risk is asymmetrically skewed to the upside, and the downside scenario requires active OPEC compensatory production that has historically been slow to materialise. For risk managers and portfolio constructors, the practical takeaway is that hedging the upper end of this range is cheap insurance at current implied volatility levels.
PRICE
INDIA'S MACRO TRANSMISSION: CAD, INFLATION, FISCAL
India imports approximately 85–88% of its crude oil requirements, making it structurally the most oil-price-sensitive large emerging market economy. The macro transmission runs through four channels simultaneously, and in the current environment, all four are firing.
India's oil vulnerability is not a risk scenario. It is the base case. The only variable is the severity of transmission, not whether it occurs.
Current Account Deficit: India's merchandise trade deficit widens directly with the oil price. Every $10/bbl sustained increase in crude costs India approximately $14–15 billion per year in additional import payments, assuming flat volume. At Brent averaging $85–90 (the Goldman base case), India's current account deficit could breach 3% of GDP — a level historically associated with rupee stress and foreign portfolio outflows. At $95–100, the trajectory becomes materially destabilising without significant intervention.
Inflation: India's WPI and CPI transmission from oil is lagged but pronounced. The direct route runs through fuel retail prices, LPG, and diesel (which feeds into freight and food prices). The indirect route runs through fertilizer input costs, which affect agricultural output prices. The government has historically absorbed part of the pass-through through OMC under-recoveries and excise cuts, but fiscal space for sustained subsidy is limited — particularly after pandemic-era deficit expansion.
Fiscal Deficit: Petroleum taxes (excise + GST compensation) account for a meaningful share of central government revenue. When the government cuts retail fuel prices or absorbs OMC losses to contain CPI, it sacrifices revenue on one side while potentially adding expenditure on the other. The fiscal arithmetic deteriorates nonlinearly above $85 Brent.
Monetary Policy: The RBI's inflation targeting framework puts it in an uncomfortable position. Oil-driven CPI acceleration is supply-side in origin — rate hikes do not fix an oil shock. But if the rupee weakens materially on CAD deterioration, imported inflation becomes embedded, and the RBI faces pressure to tighten precisely when the growth impulse from higher oil costs is already contractionary. This is the stagflation trap: the growth-inflation tradeoff worsens, and there is no clean policy exit.
MACRO VARIABLE | PRE-SHOCK BASELINE | AT $85 BRENT (GS BASE) | AT $95–100 BRENT |
|---|---|---|---|
CAD (% of GDP) | ~1.5% | ~2.5–3.0% | ~3.5%+ |
CPI Inflation (Headline) | ~4.5% | ~5.5–6.0% | ~6.5–7.0% |
INR Pressure (vs USD) | Moderate | Elevated | Significant |
Fiscal Deficit Pressure | Low | Moderate | High (subsidy risk) |
RBI Rate Outlook | Easing bias | On hold / neutral | Tightening bias |
POSITION
NIFTY 50: SECTOR-LEVEL DAMAGE ASSESSMENT
The Nifty 50's aggregate earnings trajectory is meaningfully impacted by a structurally higher crude environment, but the damage is not uniformly distributed. The index has significant weighting in sectors that are either directly exposed to crude costs, indirectly exposed through margin compression, or macro-exposed through the interest rate and currency channel. At the same time, a subset of sectors benefits from elevated energy prices.
The clearest negative exposures are in aviation, oil marketing companies with retail price caps, paints and chemicals (crude-derivative input cost inflation), and any consumer-facing business that is margins-sensitive to freight and logistics costs. Auto OEMs face a two-sided squeeze: input cost inflation through steel and polymer derivatives, alongside demand compression as fuel cost of ownership rises.
The Nifty 50 has already partially priced the oil shock. What it has not priced is the duration — a prolonged $85–90 environment compresses earnings estimates by 8–12% for exposed sectors.
The beneficiary side is narrower but real. Integrated energy-petrochemical groups benefit from upstream oil production economics and from petrochemical margin expansion when product prices rise faster than feedstock in certain environments. Upstream E&P names see revenue uplift from higher crude realization. However, administered pricing and government dividend extraction historically cap the pure upside for PSU energy names.
For financial sector stocks — which dominate Nifty 50 by weight — the damage is indirect but material. Banks face a deteriorating macro backdrop: higher inflation reduces real rates and squeezes NIM recovery expectations; potential RBI hawkishness dampens credit demand; and a weakening rupee raises concerns about foreign portfolio outflows that compress valuations multiples. NBFCs with large vehicle finance books (commercial vehicles, tractors) face asset quality risks as freight economics deteriorate.
SECTOR | DIRECT OIL EXPOSURE | MACRO EXPOSURE | DIRECTION |
|---|---|---|---|
Aviation | Very High — ATF is 30–35% of costs | Moderate | Strongly Negative |
OMCs | Direct — retail price cap risk | Fiscal dependent | Negative |
Paints / Chemicals | High — crude derivatives in inputs | Low | Negative |
Autos | Moderate — polymer, freight costs | Demand slowdown | Negative |
Consumer Staples (FMCG) | Moderate — packaging, logistics | Moderate | Mildly Negative |
IT Services | Low direct | USD revenue — INR weakness is positive | Mildly Positive |
Upstream Energy | Direct revenue uplift | Dividend extraction risk | Mixed / Muted |
Integrated energy-petrochemical groups | Upstream + petchem uplift | Refining margin dependent | Cautiously Positive |
Banks & NBFCs | Indirect via macro | NIM, credit demand, FPI flows | Negative |
The medium-term implication for the Nifty 50 is that earnings estimate revisions are likely to run negative for a sustained period. The index P/E multiple is vulnerable to compression from two directions: earnings downgrades in oil-exposed sectors, and multiple compression from tighter financial conditions and weaker macro growth expectations. A Nifty target range of 21,500–22,500 over the next 12 months — representing a 10–15% discount to the pre-war trajectory — is a realistic base case if oil remains anchored above $85.
The tail risk — a 60-day disruption with production damage (the GS +$42 scenario) — could push the index to test the 19,500–20,000 zone, as the full macro transmission comes through in earnings, the fiscal deficit blows out, and the RBI is forced to choose between inflation control and growth support. That scenario warrants a defensive tilt: Overweight IT (USD revenue hedge), Underweight OMCs and Aviation, reduce Banking exposure selectively.
The Nifty's medium-term range has shifted lower. This is not a buying dip — it is a macro regime change that requires a structural reallocation away from oil-cost-exposed domestic cyclicals toward USD earners and upstream energy.
SYNTHESIS
The Brent futures curve is not forecasting a clean return to the pre-war world. The Goldman Sachs scenario matrix confirms that even optimistic outcomes — short disruption, full production recovery — leave oil in the $80s through 2027. India's macro exposure to this outcome runs through every major channel: current account, inflation, fiscal, and monetary policy. The Nifty 50's earnings trajectory is under pressure, and the duration of that pressure — not just its magnitude — is what the market has yet to fully price.
The Buy Side Lens read: the trigger is structural, not tactical; the flow is signalling persistent tightness at the front end and a permanently higher floor at the long end; the risk is asymmetrically skewed upward; the price is in a new regime above $85 with the Goldman consensus as the attractor; and the position for Indian equity is defensive — favour USD earners, reduce domestic oil-cost-exposed cyclicals, and treat any relief rally as a hedging opportunity rather than a re-entry signal.


