

Original Lens and publication context
A Buy Side Lens reading of Goldman Sachs's H2 macro roadmap: fund the railway before pricing the software.
- AI is a capex cycle with a railway-scale physical footprint, not a software cycle — and infrastructure booms raise the cost of capital where software cycles lowered it.
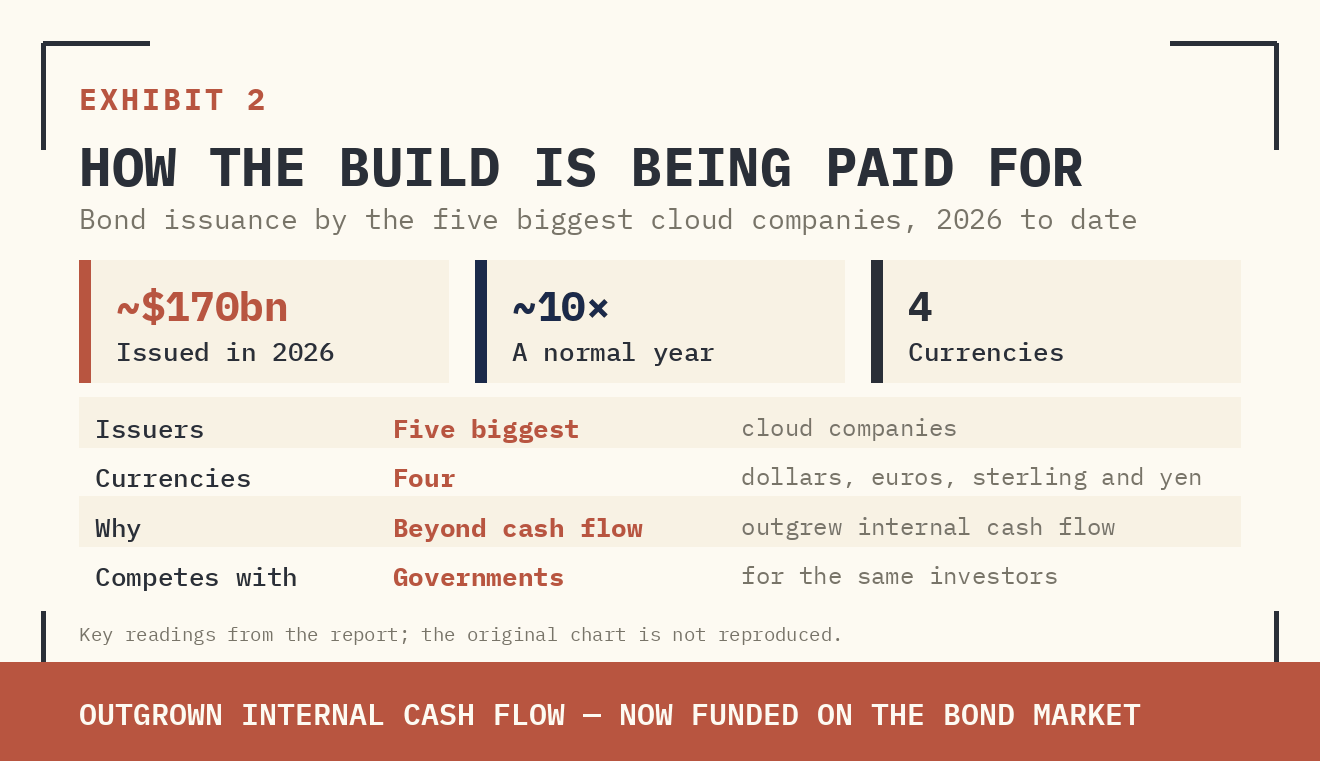
- The funding has left the balance sheet: hyperscaler credit issuance is running at roughly ten times the historical norm, with the equity channel now tapped alongside, competing with fiscal borrowing for a waning duration bid.
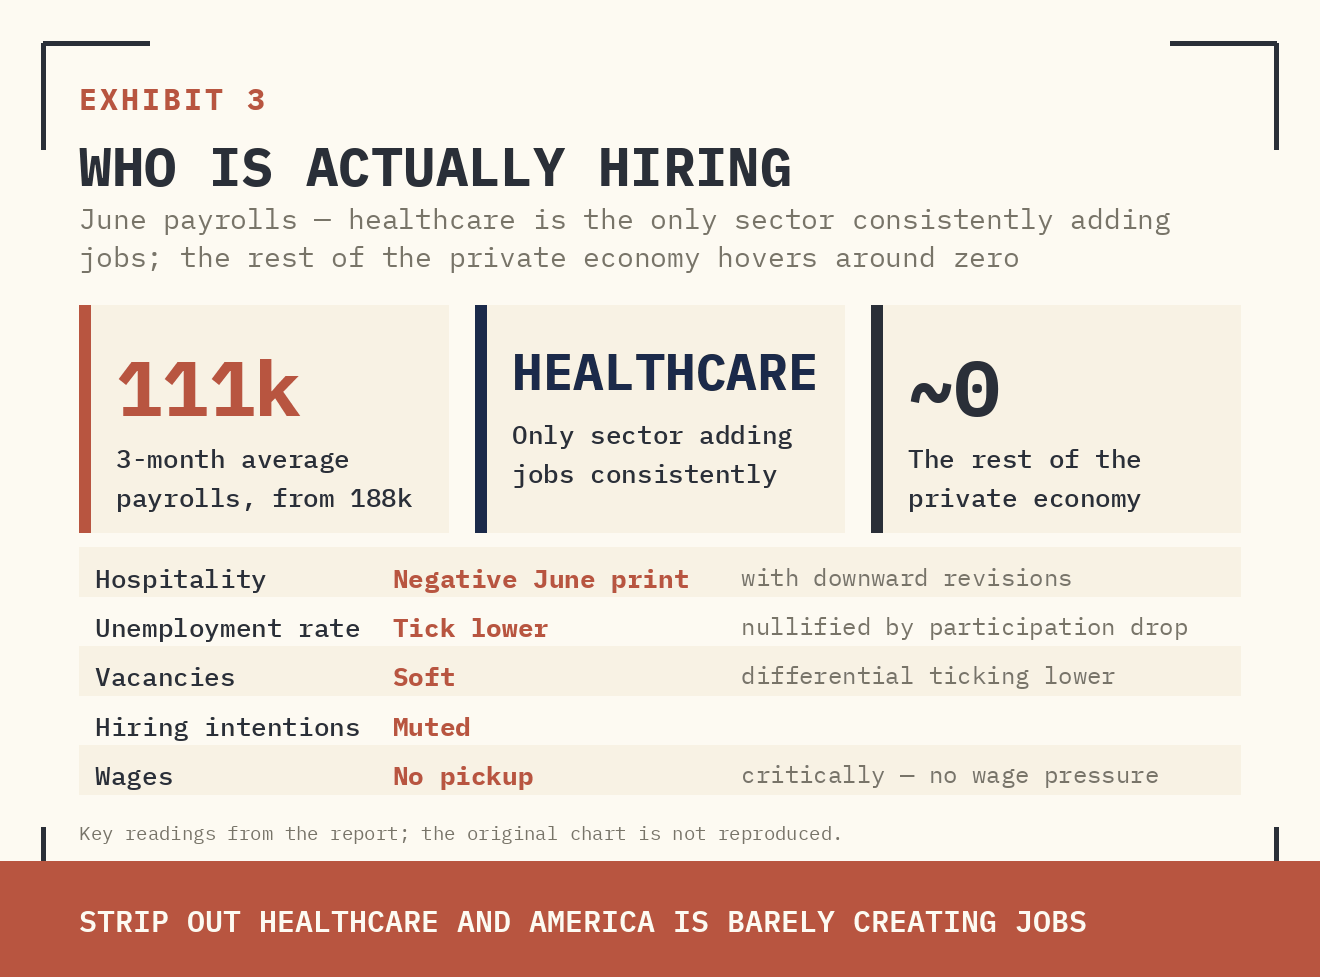
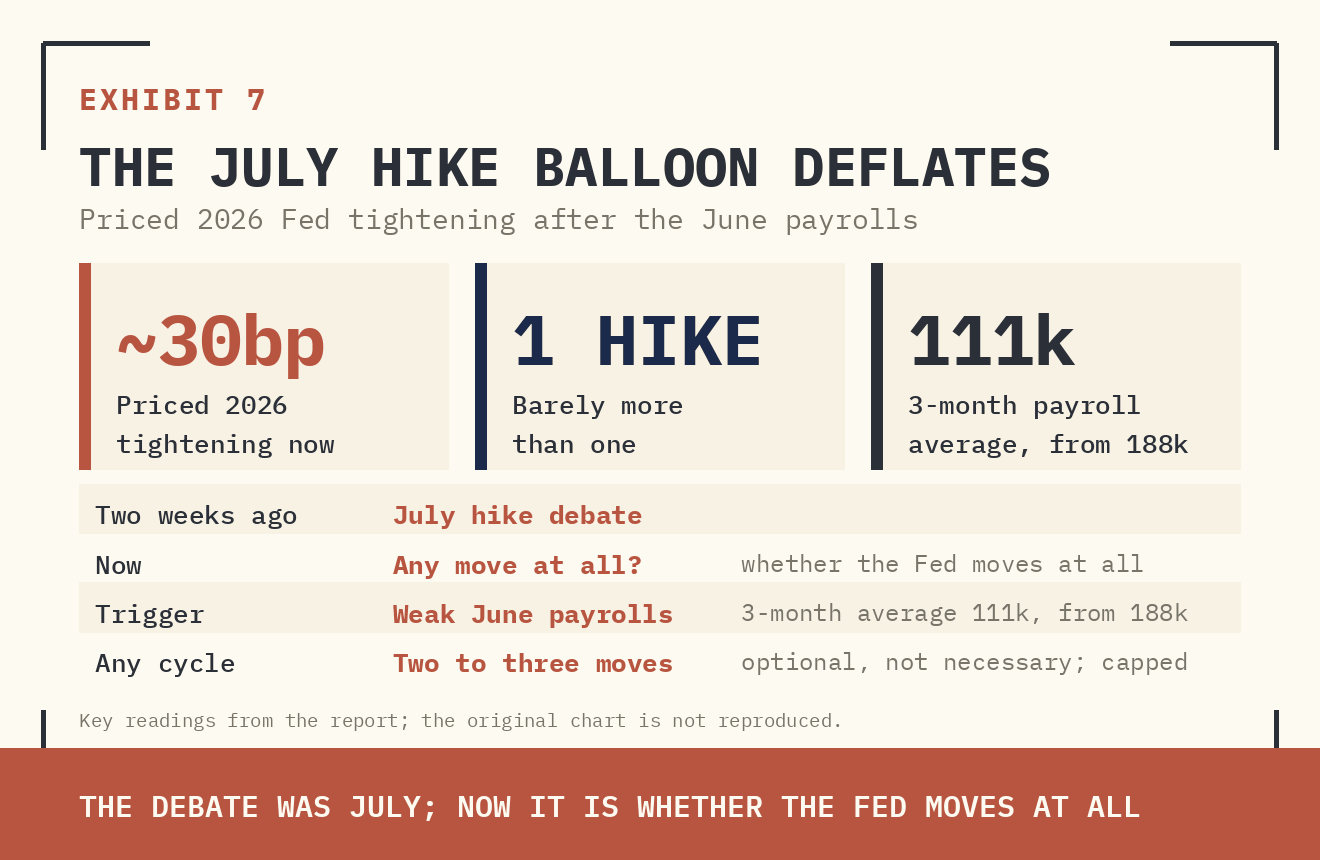
- June payrolls (three-month average 111k, health services the only job creator, no wage pickup) deflated the July hike; any tightening is optional and capped at two to three moves.
- Physical bottlenecks — power, grid, skilled construction labour, cooling — are potential headwinds to inflation normalisation if the stated capex numbers are realised.
- The trade: the front end is adequately priced; fade rallies in the belly and long end of DM curves — price the build before the benefits.
I. Railway, Not Software
Goldman Sachs's macro desk opens its H2 roadmap by attacking the market's favourite frame. AI-as-productivity-story has supported the rates outlook all year: disinflation eventually, cheaper compute, better margins, possibly fewer jobs, a lower neutral rate down the road. The desk's view is that this is likely right about the destination — and dangerously silent about the journey.
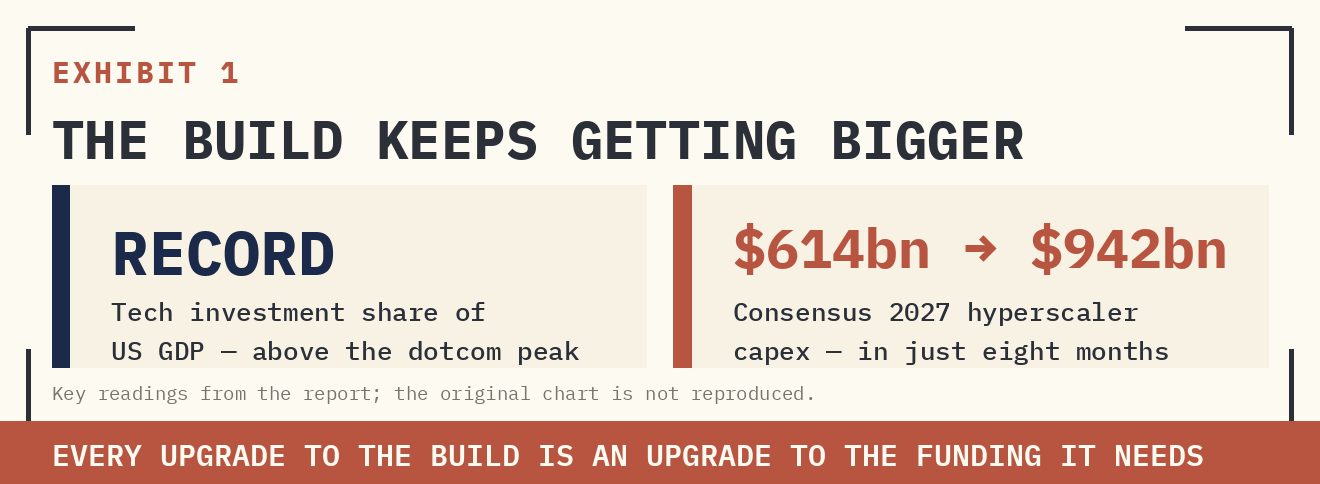
What is happening is not a software cycle. It is a capex cycle, closer in physical footprint to a railway build than to the dotcom expansion everyone keeps citing. The distinction carries the entire rates argument: the software cycle lowered equilibrium rates because it scaled on almost no capital, while infrastructure booms raise them because they compete for scarce capital — power, grid connections, skilled construction labour, cooling, and above all funding. Tech investment as a share of GDP is now at a record, above the dotcom peak, and consensus capex estimates have only moved one way.
Supplied archive exhibit · original publication context.
We keep describing AI as a software cycle while building it like a railway. Rates markets need to price the build before they price the benefits.
II. The Funding Leak
The funding has now visibly left the private balance sheet. Credit issuance by the hyperscale complex is large and still expanding — on the desk's tracking, issuance across dollars, euros, and other currencies is running at an order of magnitude above the pre-2025 norm — and the equity channel is now being tapped alongside it. This is the mechanical heart of the note: every incremental bond sold to fund a data centre is duration supply competing with government paper for the same, visibly waning, duration bid. The fiscal supply story that has weighed on DM long ends all year has acquired a second, private-sector leg.
Supplied archive exhibit · original publication context.
Layer on the physical bottleneck risk if the stated capex numbers are realised — power, grid, skilled construction labour, cooling — and the desk sees potential headwinds to inflation normalisation itself. The burden of proof from here sits with the productivity gain: whether it emerges, and how long it takes. Until it does, the known deserves more weight than the promised: more competition for capital, private and public, credit and equity.
The desk is candid that the theme is hard to trade cleanly — AI may still deliver the disinflation and lower neutral rate the software framing implies. But an enormous physical build must be funded first, and the funding has to come from somewhere. The conclusion: this caps how far rallies in the belly and long end of DM curves can extend from here.
Figure 01 · Conceptual framework
Why an AI buildout reaches the yield curve
III. The July Hike Fizzle
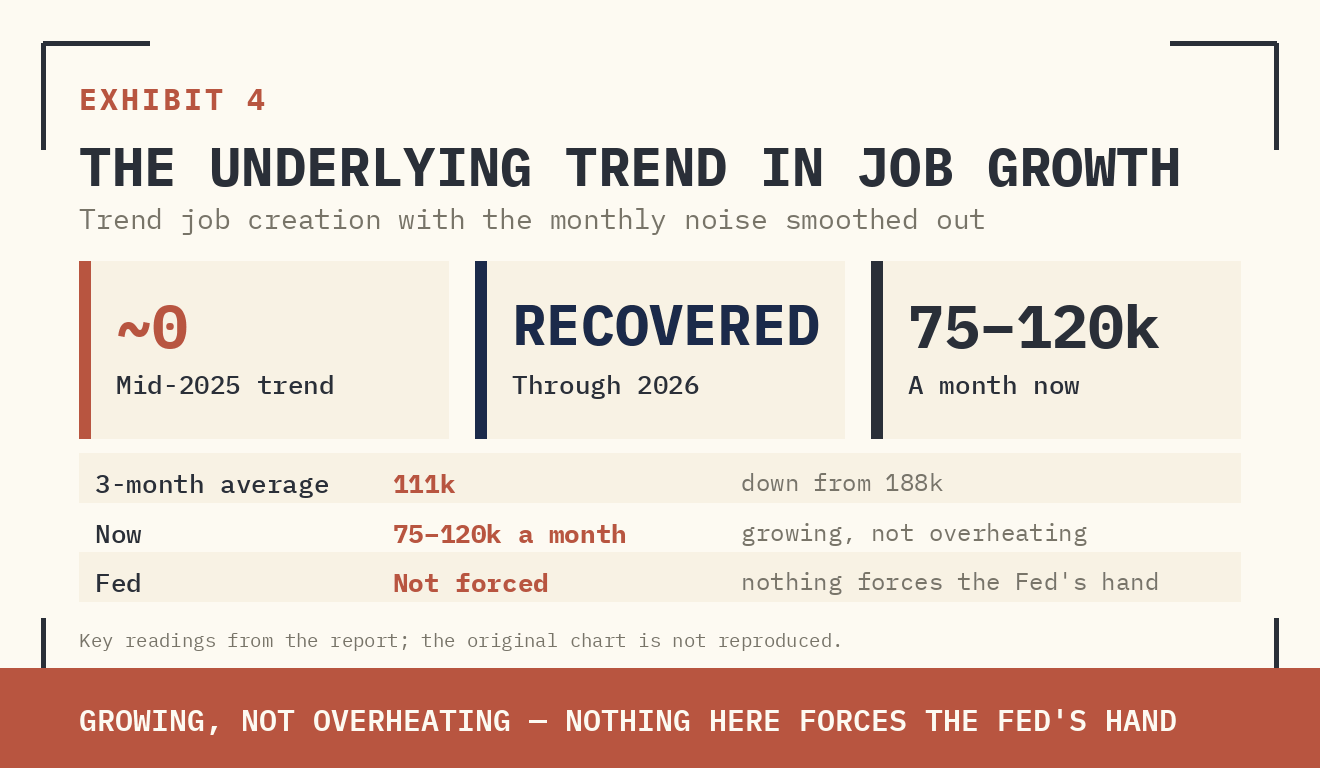
Payrolls took the air out of the July hike balloon. The three-month average of nonfarm payrolls is down to 111k from 188k; the tick lower in unemployment was nullified by a falling participation rate; revisions plus a negative June print for hospitality leave health services as the only real job creator. The softness is corroborated everywhere the desk looks: soft vacancies, a declining labour-market differential, muted hiring intentions, and critically no wage pickup.
Supplied archive exhibit · original publication context.
Supplied archive exhibit · original publication context.
Sintra reinforced the shift. Chair Warsh gave away little — the Greenspan-era communication style is clearly deliberate — but characterised inflation risks as having come down, and his AI commentary pointed at the destination (supply-side effects that could lower neutral rates) rather than the cost-of-capital journey this note is built on. The combination compresses hike risk without eliminating it: the labour data is soft, not disastrous, and it buys the Fed time.
The desk's position: the Fed could hike, but it is optional. A hike would burnish inflation-fighting credibility at seemingly minimal cost. It is less clear it is necessary — energy is doing the work, sequential inflation should fall from here helped by PCE methodology changes — and there is a deeper question of whether hikes are even the right tool for a capex-driven cycle, when the rate-sensitive sectors hikes actually reach, housing above all, are already struggling. If the Fed goes, there is no case for a sustained cycle beyond two to three moves. Inflation prints decide everything.
Supplied archive exhibit · original publication context.
IV. What Is Priced
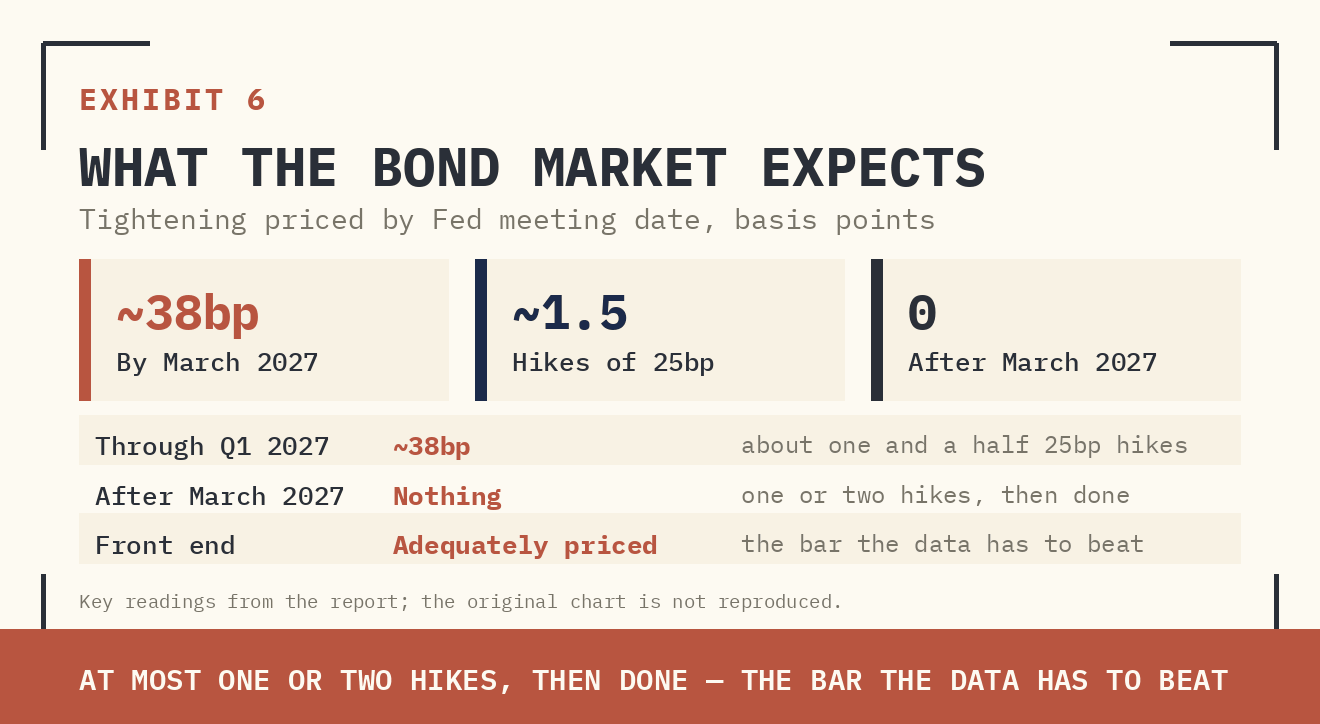
The strip carries roughly 38bp — about one and a half 25bp hikes — through March 2027, front-loaded into the September-to-January window, and nothing thereafter. Against the desk's own view (optional, shallow, data-dependent), the front end is adequately priced: not worth fighting in either direction. The trade therefore lives further out the curve, where the cost-of-capital argument does its work.
Supplied archive exhibit · original publication context.
Supplied archive exhibit · original publication context.
V. The Trade
SLEEVE | POSITION | HORIZON | DRIVER |
|---|---|---|---|
Front end | Adequately priced at ~1.5 hikes through Q1 2027; hold, do not fight. | Data-dependent | Optional-hike regime |
Belly & long end | Fade rallies; dual duration supply (fiscal + private capex funding) caps the upside. | H2 2026 | Cost of capital |
Curve | The implied structure: front end anchored or rallying, long end pinned by supply — steepening bias. | H2 2026 | Supply vs policy |
Watchlist | Inflation prints into September; hyperscaler issuance calendar; power/grid/labour bottleneck data. | Rolling | Decides the hike |
This desk note accompanies the consolidated Buy Side Lens report "Built Like a Railway, Priced Like Software" (BSL-018, 07 July 2026), which carries the comparison against the equity view.


