

Original Lens and publication context
The pin releases Friday. The ceasefire expires Tuesday. The question is no longer how high — it is what breaks first when the mechanical bid pauses.
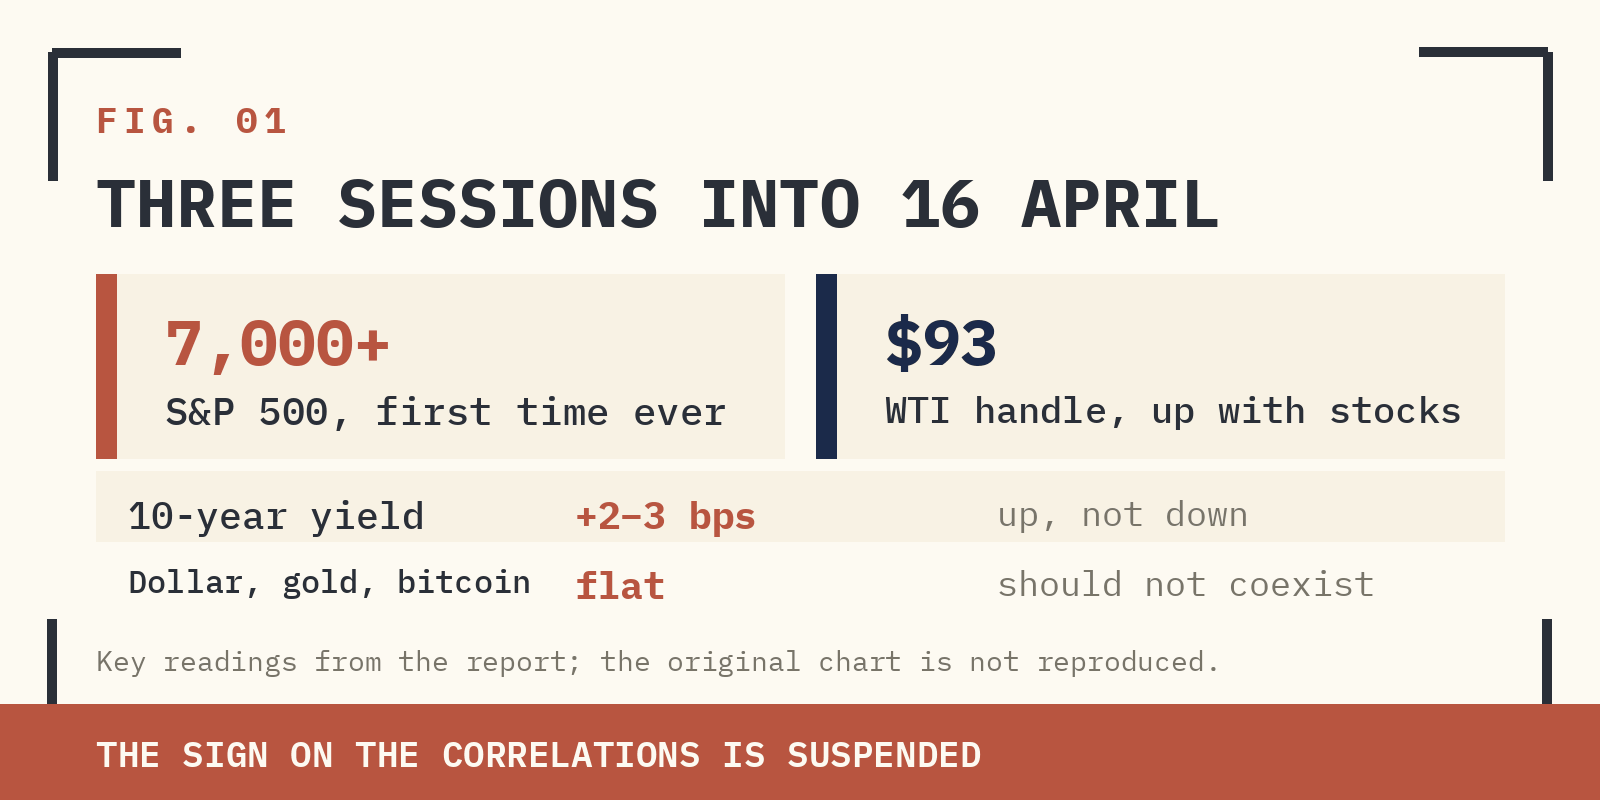
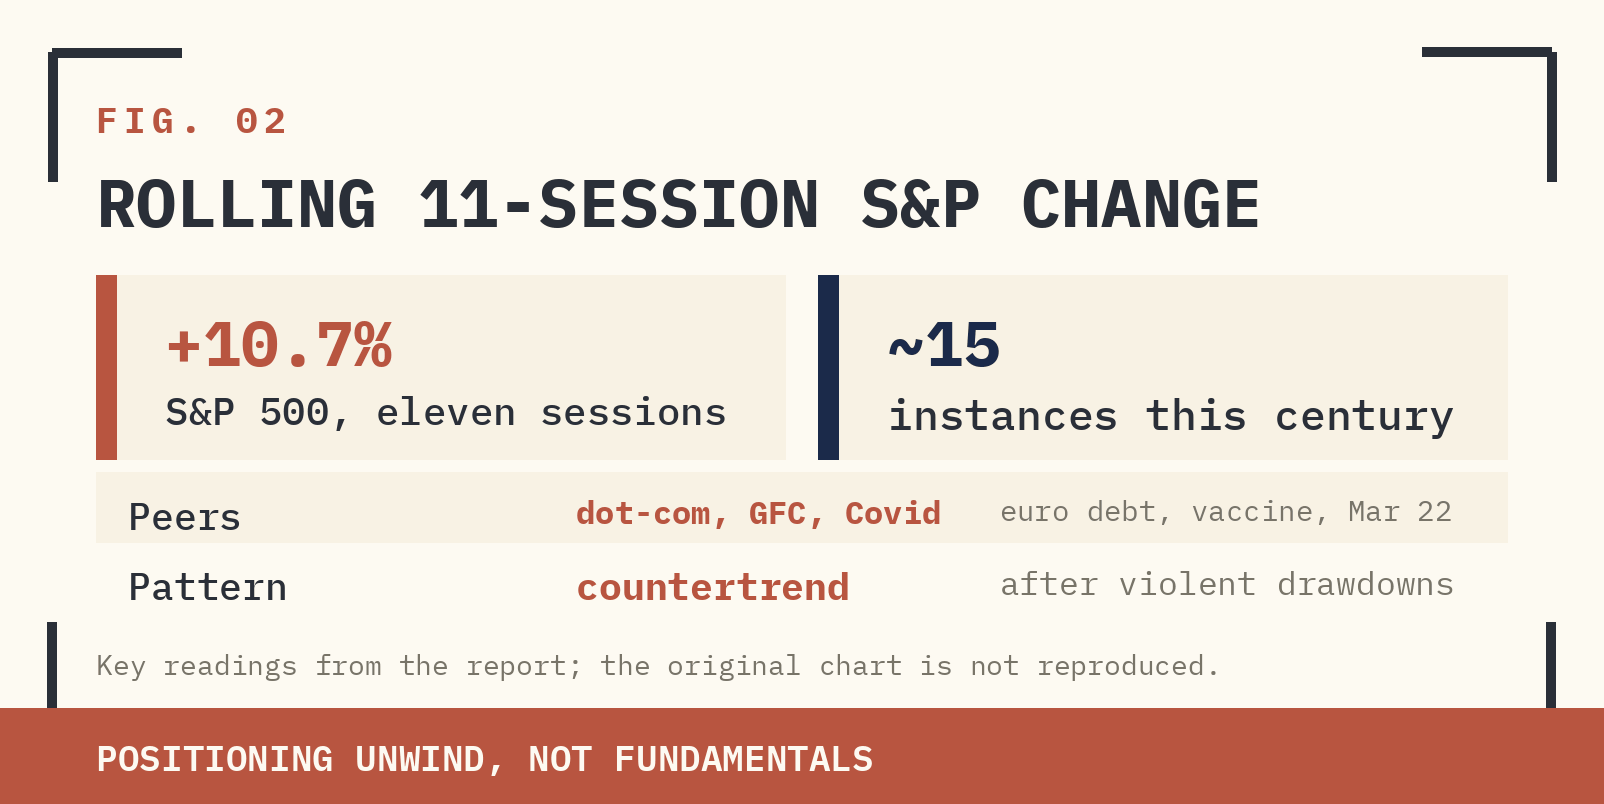
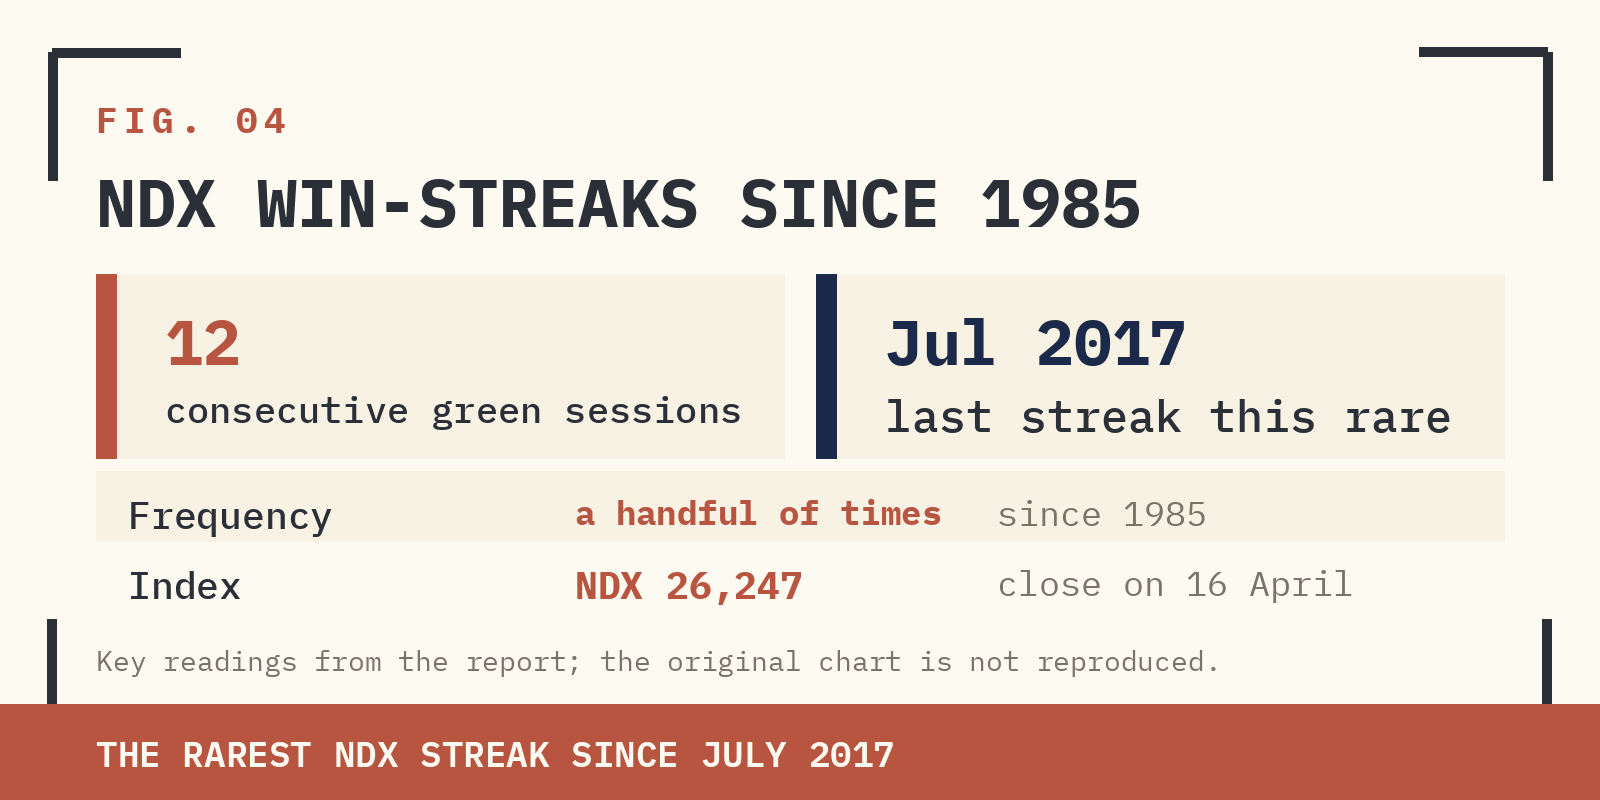
- S&P 500 is above 7,000 for the first time and the NDX is up twelve straight sessions, the rarest streak since July 2017. The eleven-session S&P gain of +10.7% has been matched only about fifteen times this century — mostly in countertrend rallies.
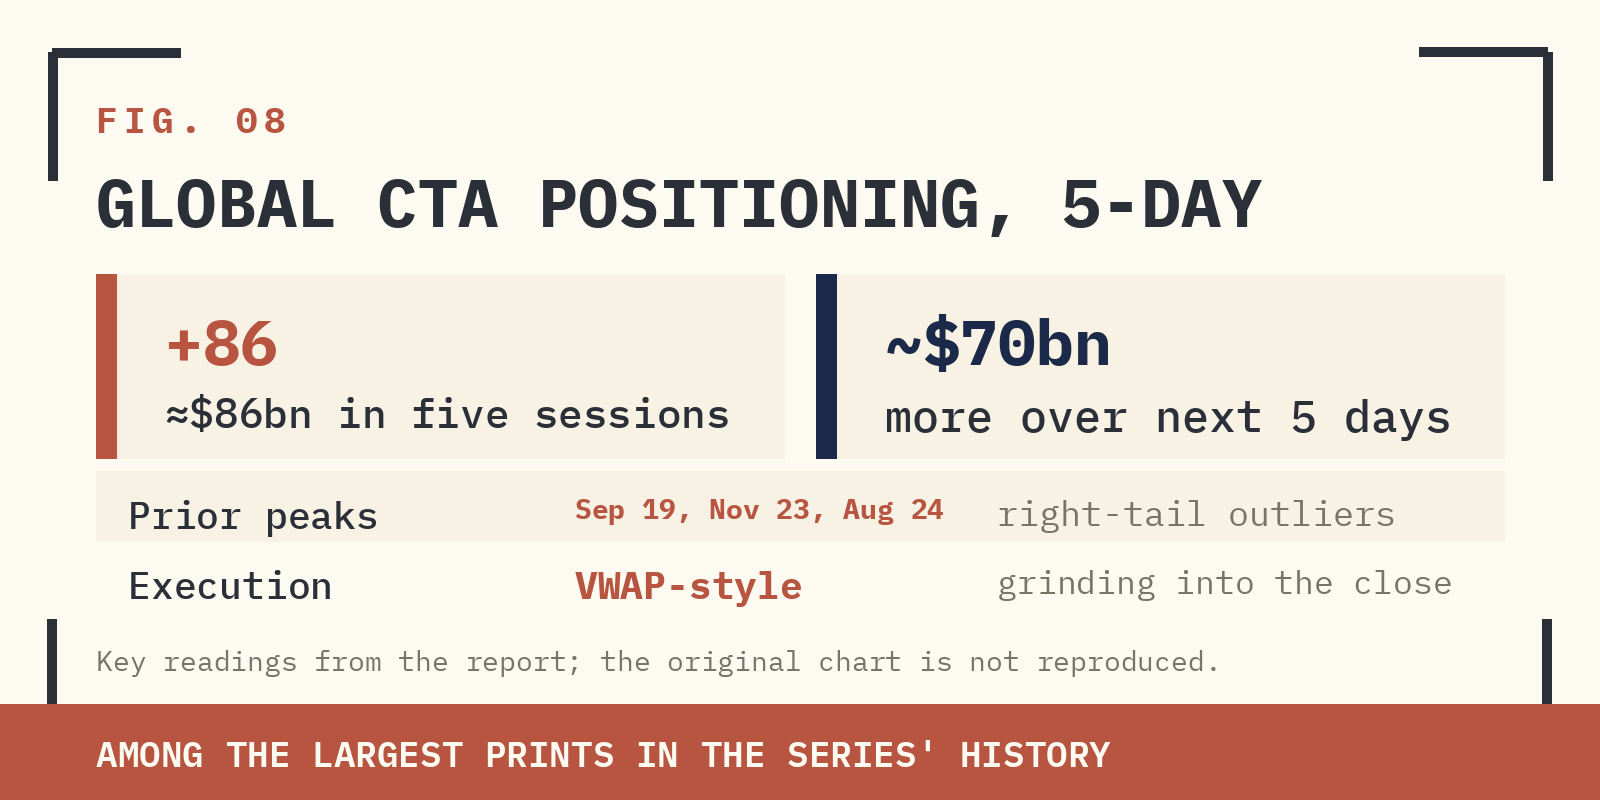
- The bid is mechanical, not fundamental: systematic trend-followers bought roughly $86 billion of global equities in five sessions, and desk models have them buying another ~$70 billion over the next five. Oil, credit, the 10-year yield and breadth all refuse to confirm.
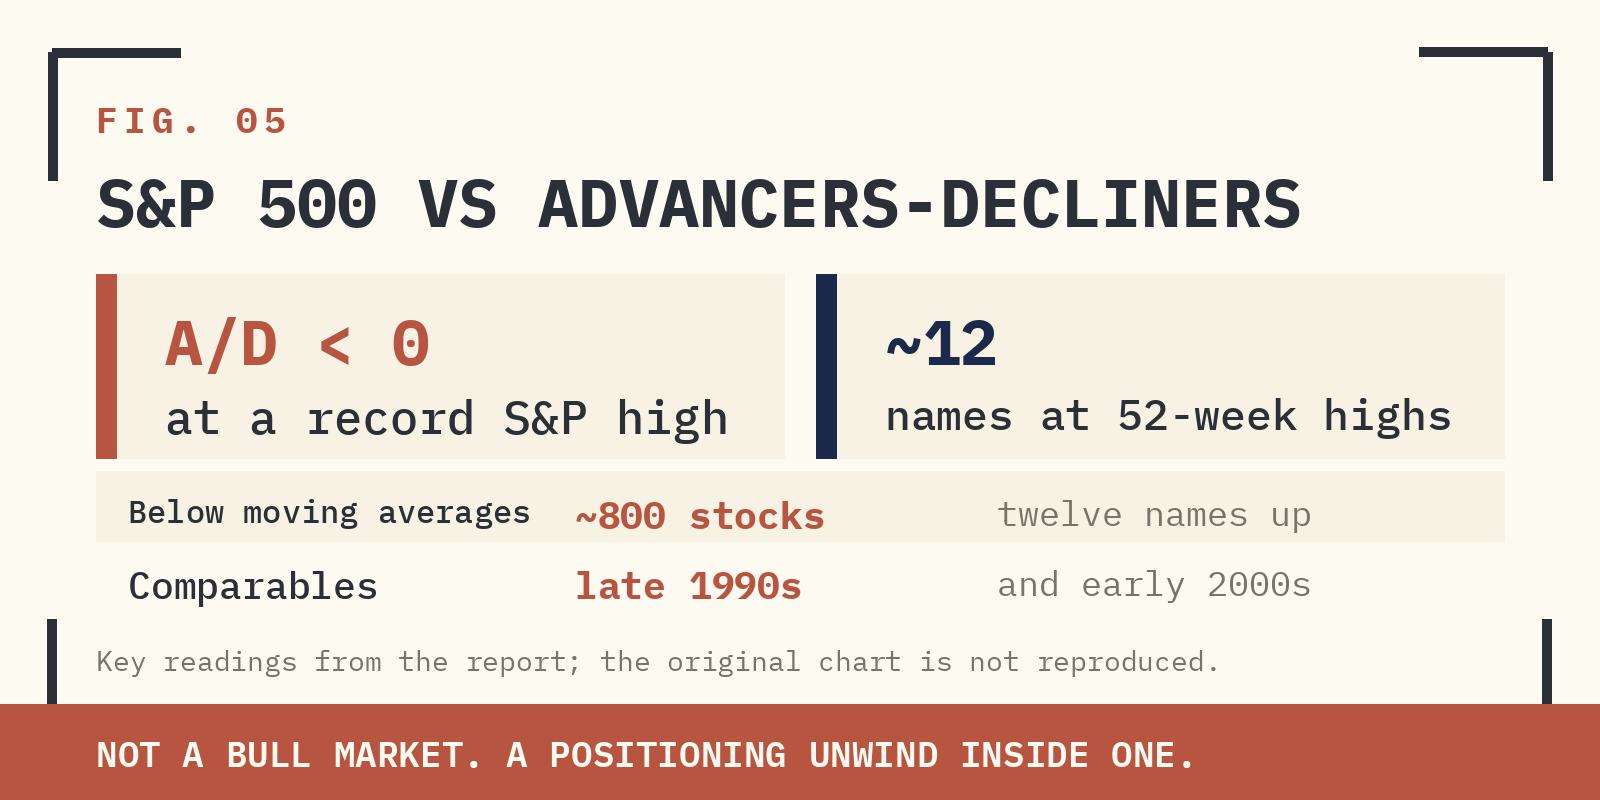
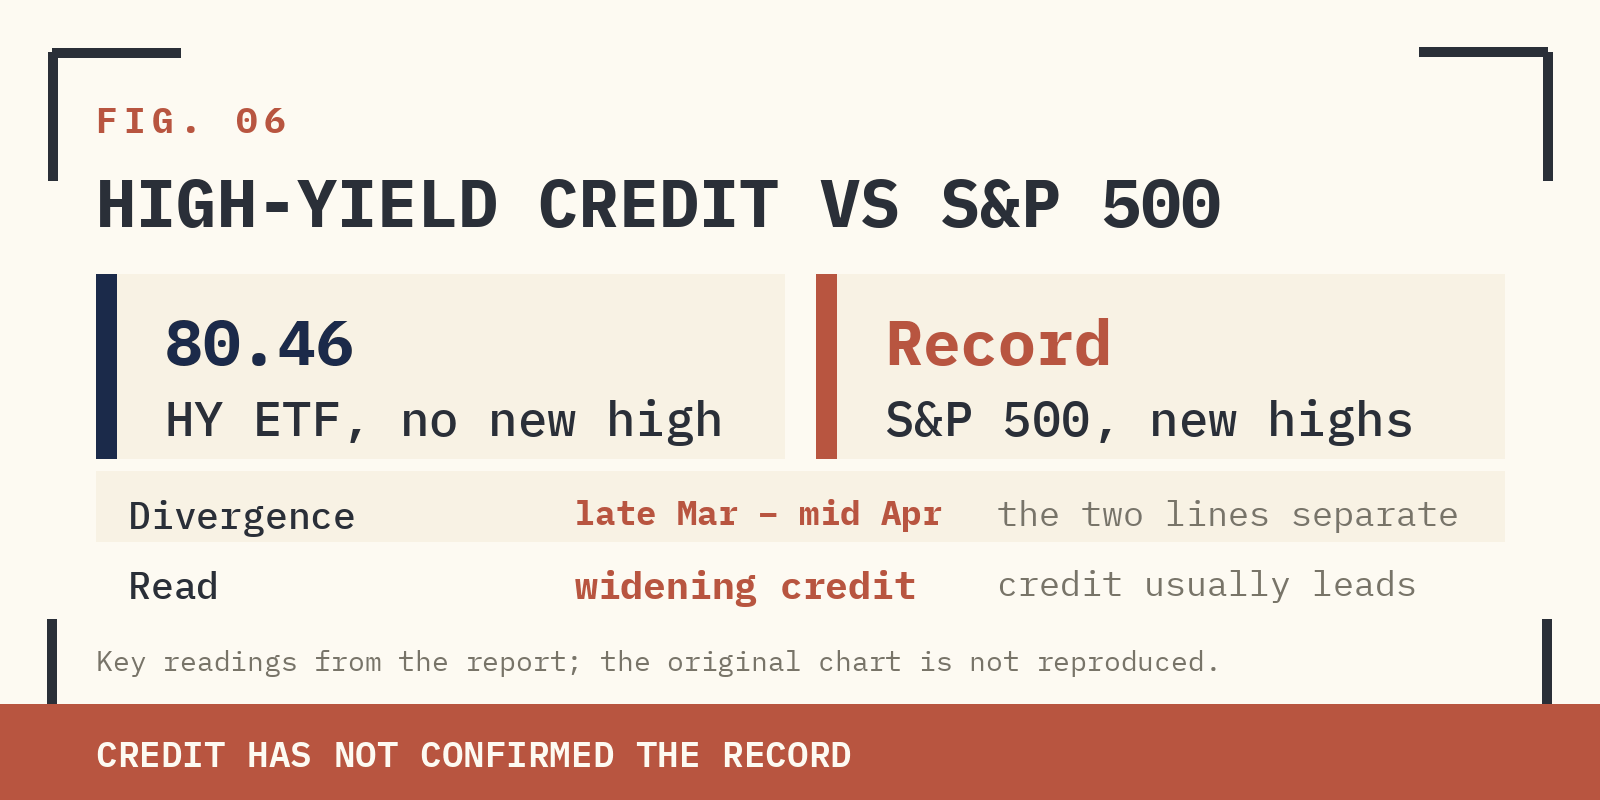
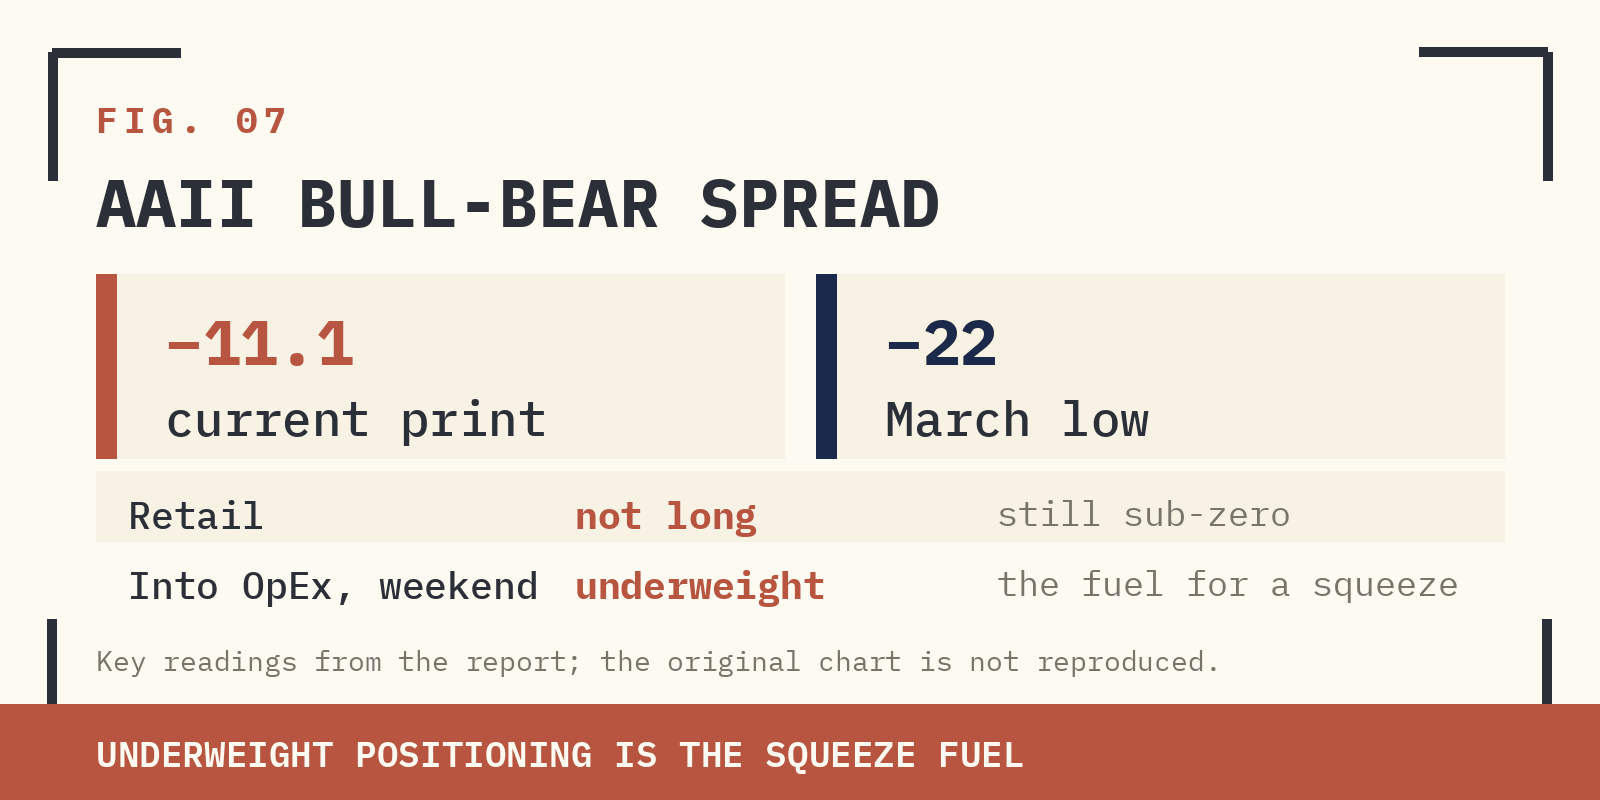
- Breadth and credit do not confirm: advancers-vs-decliners closed negative at a record high, only around a dozen constituents sit at 52-week highs, the high-yield bond ETF at 80.46 is well below its usual level at S&P records, and AAII bull-bear is still -11.1.
- Friday's options expiry releases the gamma pin that has held the tape in the 7,000–7,100 band all week; Tuesday's Iran ceasefire expires. Probability markets price a permanent peace deal at only 24% by 22 April and 41% by 30 April.
- Position: do not fight the systematic bid yet — be long, be hedged: right-tail exposure plus out-of-the-money put spreads on the narrow-leadership names. The market is long the deal track; almost nobody is positioned for combat resuming — the ignored tail is cheapest to insure.
01 | THE SETUP
- The move. S&P 500 above 7,000 for the first time. NDX up twelve consecutive sessions — the rarest streak since July 2017. Eleven-session rolling S&P gain +10.7%, a pace matched only fifteen times this century.
- The driver. Iran ceasefire chatter plus roughly $86 billion of global equities bought by systematic trend-followers in five sessions. Not fundamentals.
- The tell. Oil, credit, the 10-year yield and market breadth are all refusing to confirm the new highs. The desk consensus has shifted from chasing to waiting.
- The catalysts. Friday’s options expiry releases the gamma pin that has stabilised the tape all week. Tuesday’s Iran ceasefire expires. Between the two sits a weekend of headline risk.
02 | THE UP-MOVE: HOW WE GOT HERE
A session that refuses to be internally consistent. S&P at all-time highs. WTI on a $93 handle. 10-year yield up 2–3 bps. Dollar, gold and bitcoin flat. Four of those five should not be coexisting.
Supplied archive exhibit · original labels. Read alongside the editorial corrections.
An eleven-session +10.7% move is rare — roughly fifteen instances this century. The company is uniform: each followed a violent drawdown, each was driven by positioning unwind rather than fundamentals, and most were countertrend rallies inside ongoing bear tapes.
Supplied archive exhibit · original labels. Read alongside the editorial corrections.
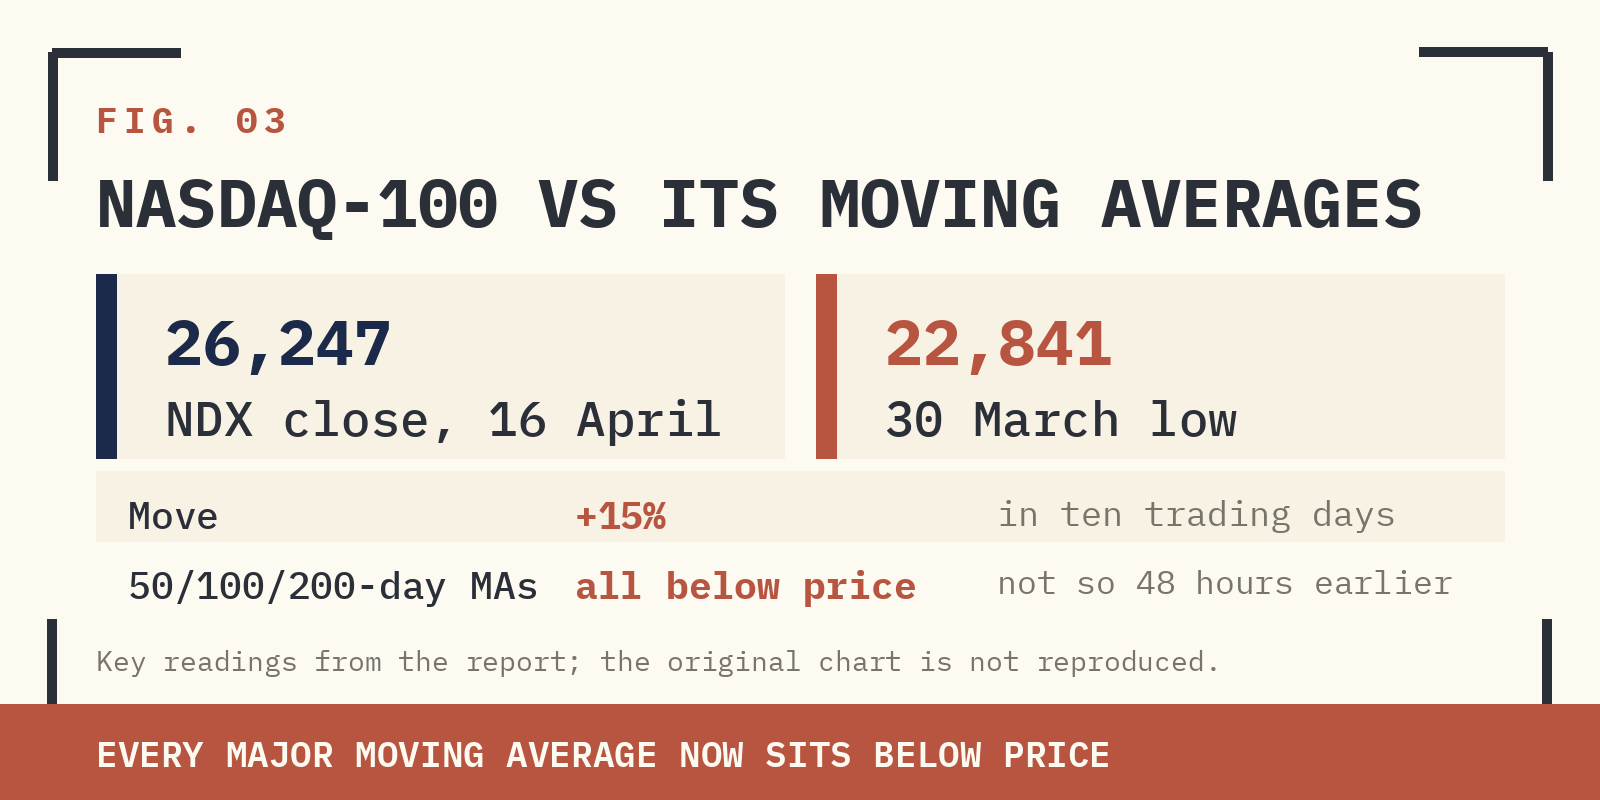
NDX closed 26,247 on 16 April. Twelve green sessions. The index reclaimed the 100-day and 200-day moving averages in a single leg from the 30 March low of 22,841 — a 15% move in ten trading days. Every major MA now sits below price. A twelve-day streak is a handful-times event since 1985.
Supplied archive exhibit · original labels. Read alongside the editorial corrections.
Supplied archive exhibit · original labels. Read alongside the editorial corrections.
The leadership underneath is the problem. With S&P at a fresh high, advancers-vs-decliners closed negative. Only around a dozen constituents are at 52-week highs alongside the index. The historical comparables for that combination are late 1990s and early 2000s.
Supplied archive exhibit · original labels. Read alongside the editorial corrections.
Twelve names up. Eight hundred below moving averages. Not a bull market. A positioning unwind inside one.
03 | THE NON-CONFIRMATION: CREDIT AND SENTIMENT
High-yield credit has bounced with the S&P but has not printed new highs. At 80.46, it sits well below the level that normally accompanies SPX records. Two lines that moved together through 2024 and early 2025 have visibly separated at the right edge. That is not the behaviour of tight credit. It is the behaviour of widening credit.
Supplied archive exhibit · original labels. Read alongside the editorial corrections.
AAII Bull-Bear at -11.1, off the -22 March low. Still negative. Retail is not long. Underweight positioning going into Friday OpEx and a weekend Iran-headline risk window is the fuel that makes a squeeze mechanical.
Supplied archive exhibit · original labels. Read alongside the editorial corrections.
04 | THE MECHANICAL BID: WHY CTAS DROVE EVERYTHING
The marginal buyer is not discretionary. It is mechanical, it is measured in tens of billions, and it came from three pockets in parallel.
Systematic trend
Global CTA positioning, five-day change, printed +86 — roughly $86 billion of global equities bought by systematic trend in five sessions. Prior comparables: September 2019, November 2023, August 2024. Each a right-tail outlier.
Supplied archive exhibit · original labels. Read alongside the editorial corrections.
The forward demand
Buying does not stop here. Desk models have the CTA cohort positioned to purchase another ~$70 billion of global equities over the next five sessions — and that estimate assumes a flat tape. CTAs execute VWAP-style, grinding into the close regardless of news flow. That is what has made this week’s low-headline sessions drift higher on thin participation: a mechanical bid that does not need a catalyst to fire.
What the historical precedent says
The three prior CTA-demand peaks of this magnitude (Sep 2019, Nov 2023, Aug 2024) tell a consistent story — short-term digestion, medium-term strength:
DATE | 2-WEEK | 1-MONTH | 3-MONTH |
|---|---|---|---|
16 Sep 2019 | −0.71% | −0.28% | +6.46% |
17 Nov 2023 | +1.79% | +4.54% | +10.89% |
26 Aug 2024 | −2.60% | +2.29% | +7.21% |
Average | −0.51% | +2.19% | +8.18% |
Tbl. 01 — S&P 500 forward returns after prior CTA-demand peaks. Two-week action mixed, but one- and three-month returns have been consistently positive.
Call skew
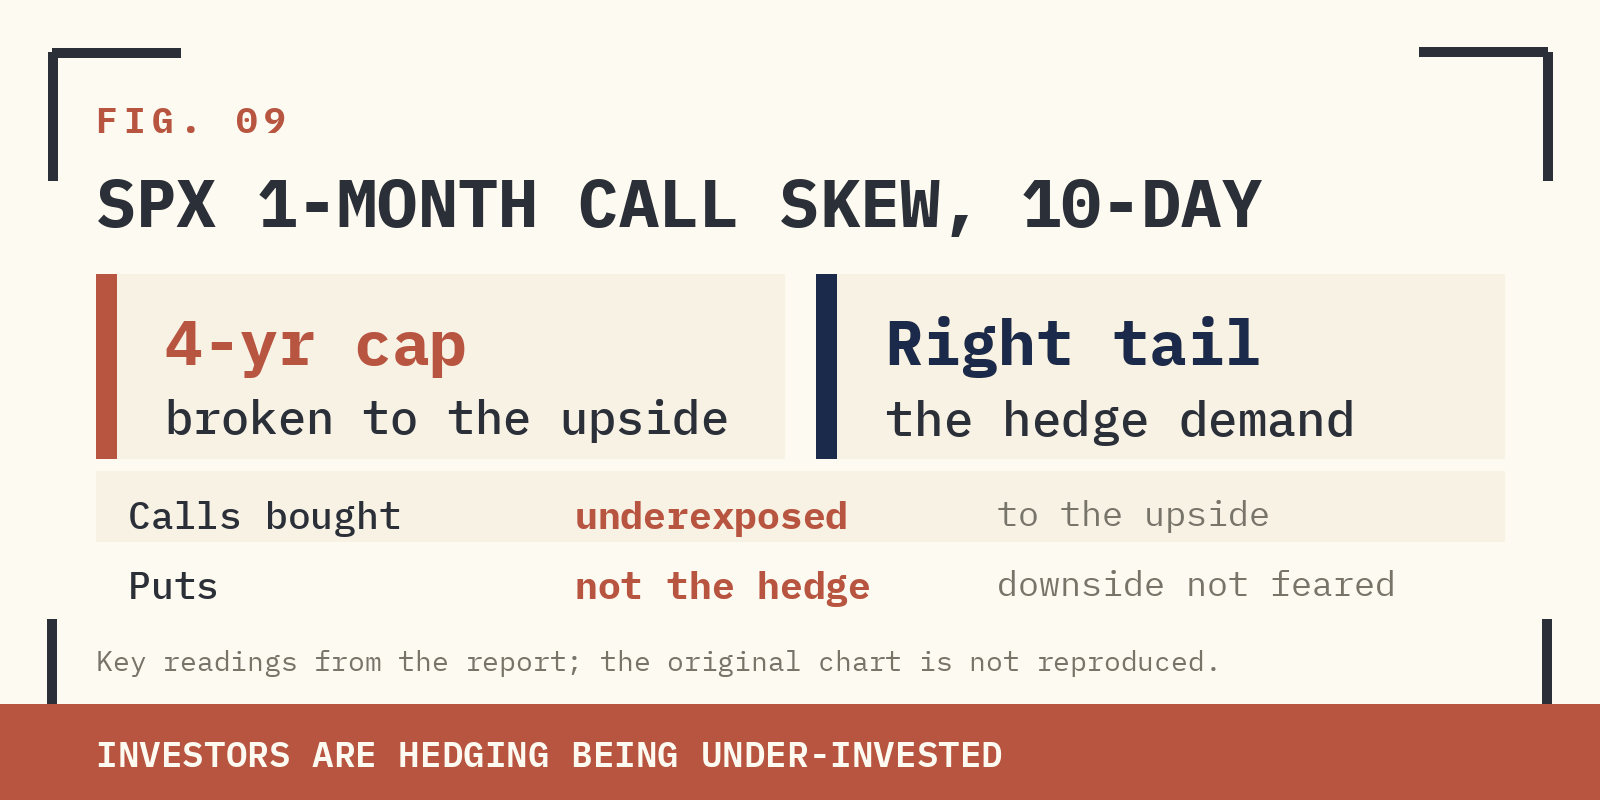
SPX one-month call skew, 10-day change, has broken above the cap that held for four years. The hedge demand is for right-tail, not left-tail. Investors buying calls because they are underexposed to upside, not puts because they fear downside.
Supplied archive exhibit · original labels. Read alongside the editorial corrections.
05 | WHAT "GAMMA UNCLENCH" ACTUALLY MEANS
A term that is being used constantly in market commentary this week. Worth unpacking cleanly, because it is driving most of the intraday stability — and explains why Monday looks different.
The mechanic
Market-makers (dealers) sit on the other side of every public options trade. When the public aggressively buys calls, dealers are short those calls. To stay risk-neutral, they hedge. If the index rallies toward the strike, dealers buy futures. If it dips away from the strike, they sell futures. The rate at which that hedge needs to change as price moves is an options Greek called gamma.
Dealer long gamma
When dealers hold option exposure that forces their hedge to work against price movement — requiring a net long option-gamma position, not established by public call-buying alone — they are said to be long gamma at that level. Long gamma stabilises. Rally? Dealers sell futures to re-hedge. Selloff? Dealers buy. The tape gets pinned. Realised volatility is suppressed. This is what has been happening in the S&P all week — call-gamma concentration in the 7,000–7,100 band has pinned the index and kept daily ranges tight.
The unclench
On expiry day, options carrying that gamma settle and disappear. The dealer hedging flow that was stabilising price evaporates. The pin releases. Price is no longer suppressed toward the high-gamma strike by mechanical dealer activity. The market is free to move in either direction on real flow — genuine buying, genuine selling, genuine headline reactions. Both tails open.
For 17 April expiry — today — the release starts on Monday’s tape. Between Iran headline risk over the weekend and the ceasefire expiry on Tuesday, this will be the first week since the rally began when the tape runs without a dealer-hedging pin.
The pin releases today. Monday’s tape runs on real flow, not dealer hedging.
06 | THE LEDGER, THE WARNING, AND THE IRAN READ
Iran: the ceasefire market doesn’t believe
Probability markets are pricing extension, not resolution. Polymarket’s US-Iran permanent peace deal contract: 24% by 22 April, 41% by 30 April. Volumes are material. The Trump tape on 16 April ran the full option tree — constructive, conditional, and aggressive — on the same session. Tuesday’s ceasefire expiry forces the binary.
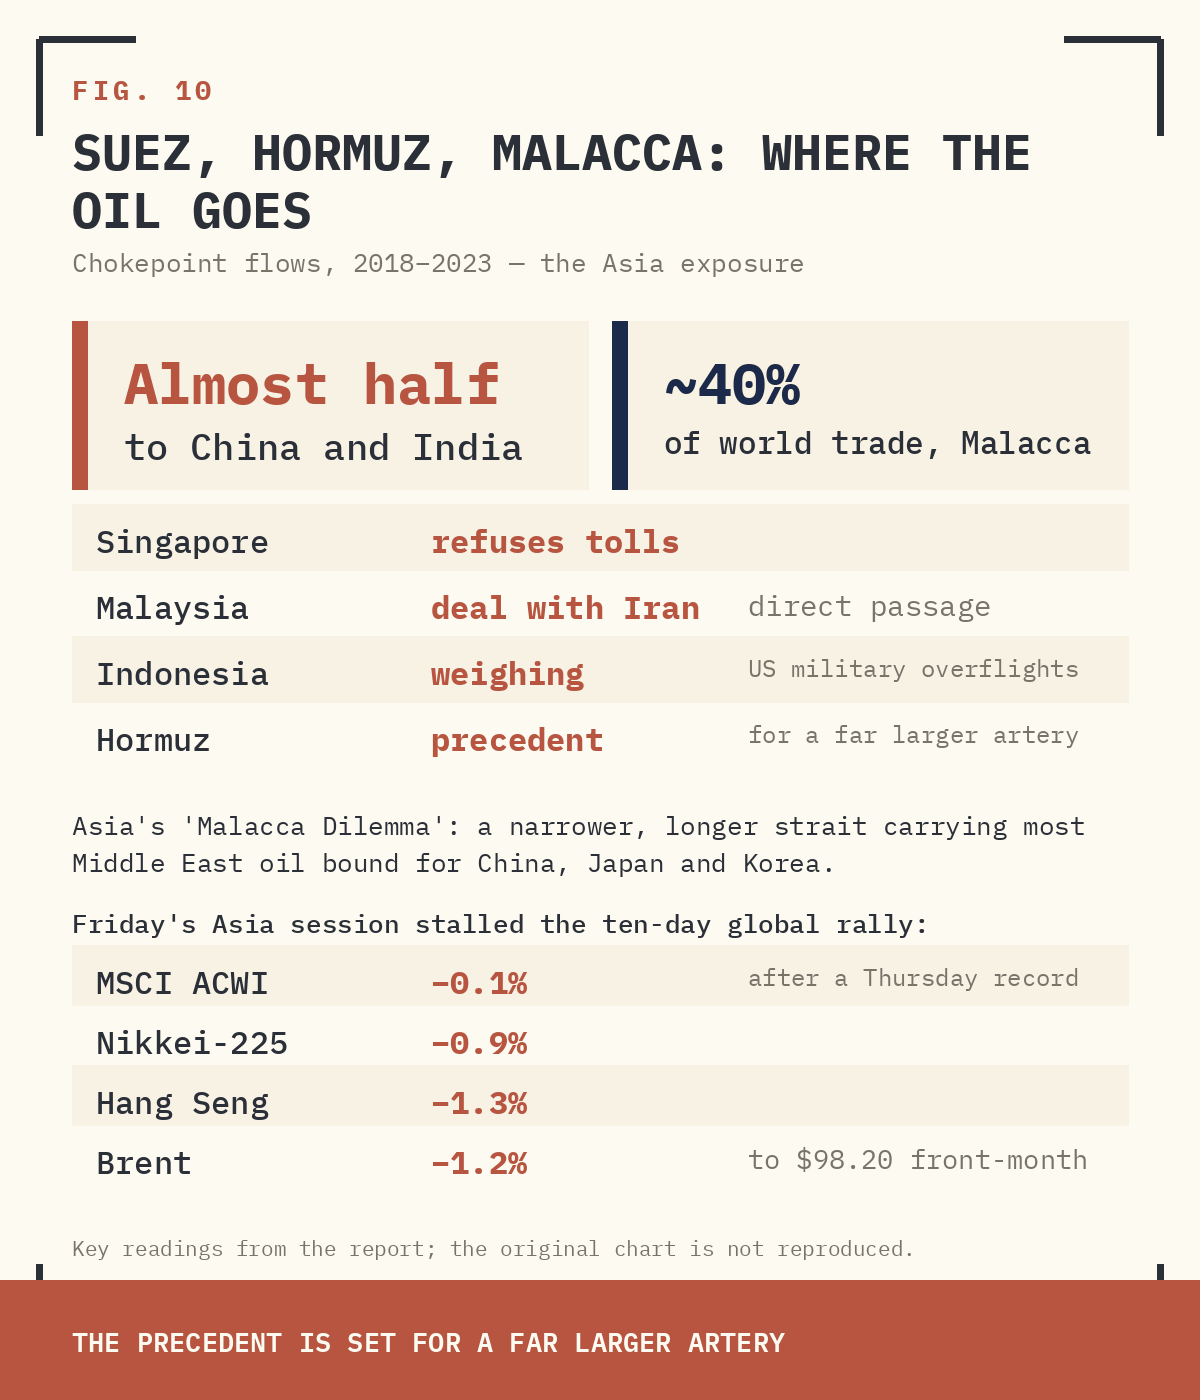
The real-time read is already doubting it. Friday’s Asia session stalled the ten-day global rally: MSCI All Country World -0.1% after a Thursday record, Nikkei-225 -0.9%, Hang Seng -1.3%, Brent -1.2% to $98.20 on the front-month. Trump’s newly-claimed Iranian concessions — surrendering nuclear ambitions, handing over nuclear material, reopening the Strait — remain unconfirmed by Tehran. Asia is trading the diplomatic signal, not a signed deal.
A second chokepoint is already building beneath the headlines. Asia’s ‘Malacca Dilemma’ — a narrower, longer strait carrying roughly 40% of global trade and most Middle East oil bound for China, Japan and Korea — is being reactivated by the Hormuz crisis. Singapore refuses to pay tolls, Malaysia has negotiated passage directly with Iran, Indonesia is weighing a US proposal for military overflights. Whatever resolves at Hormuz, the precedent is set for a far larger artery.
Supplied archive exhibit · original labels. Read alongside the editorial corrections.
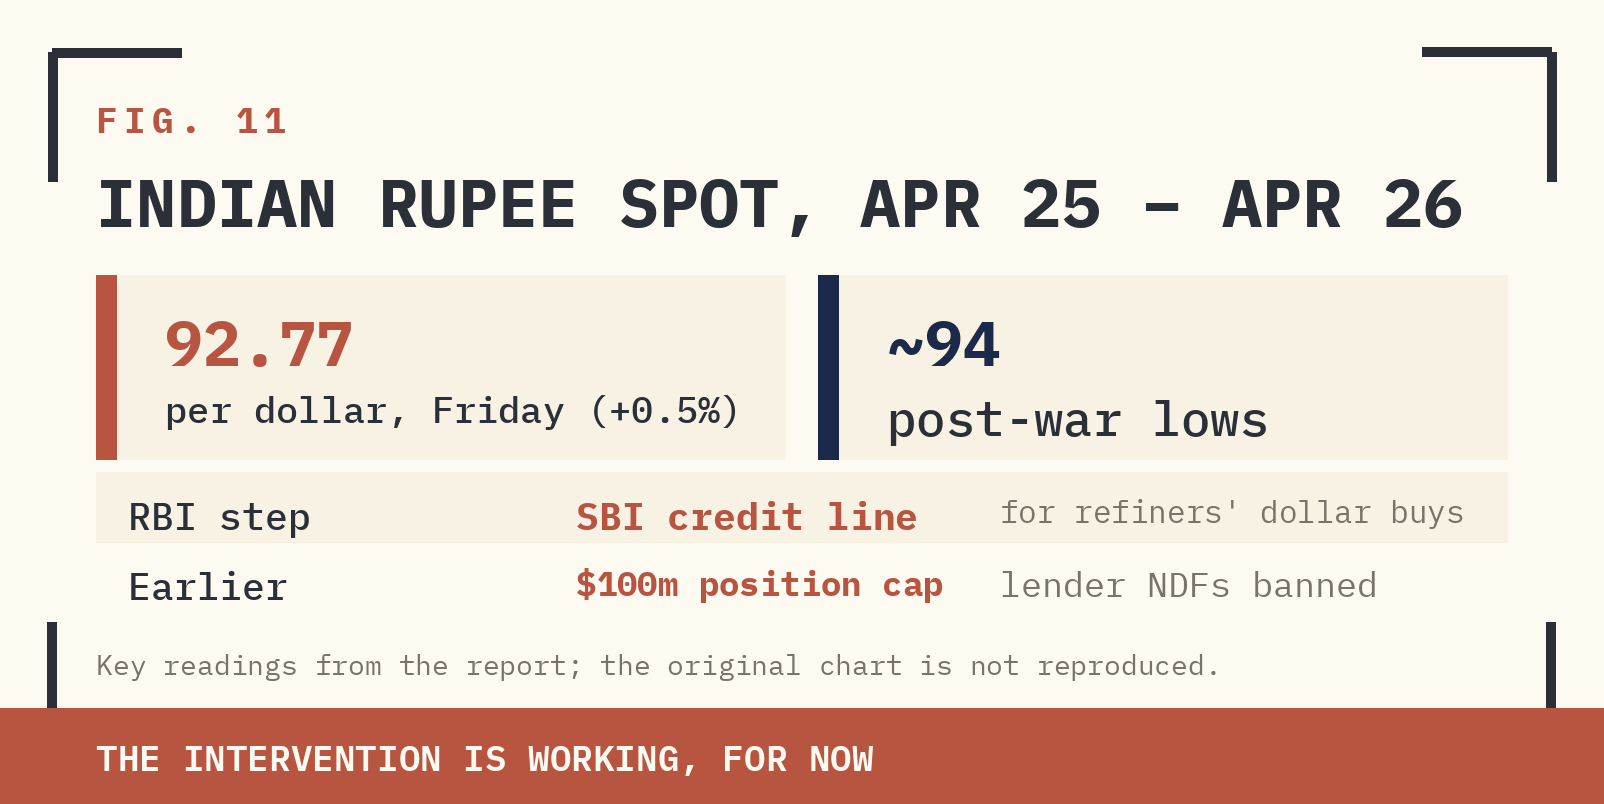
India is already showing the strain. The rupee jumped up to 0.5% to 92.77 per dollar on Friday on reports that the Reserve Bank of India has asked state oil refiners (Indian Oil, HPCL, BPCL — typically the largest dollar buyers for crude imports) to route their dollar purchases through a special credit line at State Bank of India rather than the open market. This follows earlier RBI measures capping onshore open positions at $100 million and banning lender non-deliverable forwards to clients. The currency had hit successive lows post-war; the intervention is working, for now.
Supplied archive exhibit · original labels. Read alongside the editorial corrections.
Beijing is positioning as the alternative pole. Xi held at least five high-profile meetings this week — Spain’s PM, Abu Dhabi’s Crown Prince, Vietnam’s leader — and China together with Russia vetoed a UN Security Council resolution that would have encouraged coordinated action to reopen Hormuz. A separate 40-country coalition is working on ceasefire support without US participation. The Iran crisis has become a geopolitical realignment event, not just an oil event.
Bear case
- Rates & inflation shifted. Refined capacity recovery slow. Dec ’26 oil basing low-$80s (+30%). Refined products potentially +30–50%. US: cuts → holds. Europe: holds → hikes.
- Consumer shock real. Luxury misses already printed (LVMH, Kering, Hermès).
- Credit late-cycle. Private-credit circularity plus heavy issuance. Tighter spreads improbable.
- Software / AI overhang. Terminal-value questions hit growth multiples broadly.
- H2 2026 compression. Fiscal impulse peaking now. Political mess into year-end.
Bull case
- AAII depressed. Too many doubters, not enough net long.
- De-risking flipped to chasing. Systematic buckets aligned; investors sold too much on the way down and are forced to re-risk at highs.
- AI / capex earnings intact. TSMC latest evidence.
Structural reminder — on the $31tn Treasury market
- 2008 playbook does not apply. The market behaves nothing like what that framework assumed.
- Fed as buyer of last resort — unwind described as “vicious”.
- No fiscal firepower for a sovereign-debt crisis. 2008 was private-sector. This is different.
- Timing unknowable. Plan has to be on the shelf before the wall.
07 | BUY SIDE LENS VIEW: WHAT TO WATCH, HOW TO POSITION
Position. Don’t fight the systematic bid yet. Another ~$70 billion of CTA buying is modelled over the next five sessions, and the historical precedent tilts medium-term constructive through short-term digestion. Be long, be hedged. Right-tail exposure plus OTM put spreads on the narrow-leadership names that would unwind first if momentum stops.
What to watch into next week
- Today’s OpEx: gamma unclench; first real-flow session.
- Tuesday: Iran ceasefire expiry — binary headline risk. Watch high-yield credit tightening, Dated Brent fading, and prime-brokerage data for confirmation of systematic re-risk.
Three scenarios
- Deal track: equities grind higher, oil fades, decoupling resolves by oil coming to stocks.
- Stalled framework (6-month read): oil re-rates higher, defensives and energy lead, growth multiples compress, narrow breadth becomes a weakness.
- No extension, combat resumes: oil into triple digits, 0DTE unwinds violently, narrow leadership becomes the exit door.
The market is long Scenario 1. Options are hedging Scenario 2. Almost nobody is positioned for Scenario 3. That is the asymmetry — the ignored tail is the cheapest to insure against, and the costliest to discover after the fact.


