
Original Lens and publication context
A Buy Side Lens reading of Morgan Stanley's equity strategy call: out of semiconductors, into the hyperscalers and the average stock.
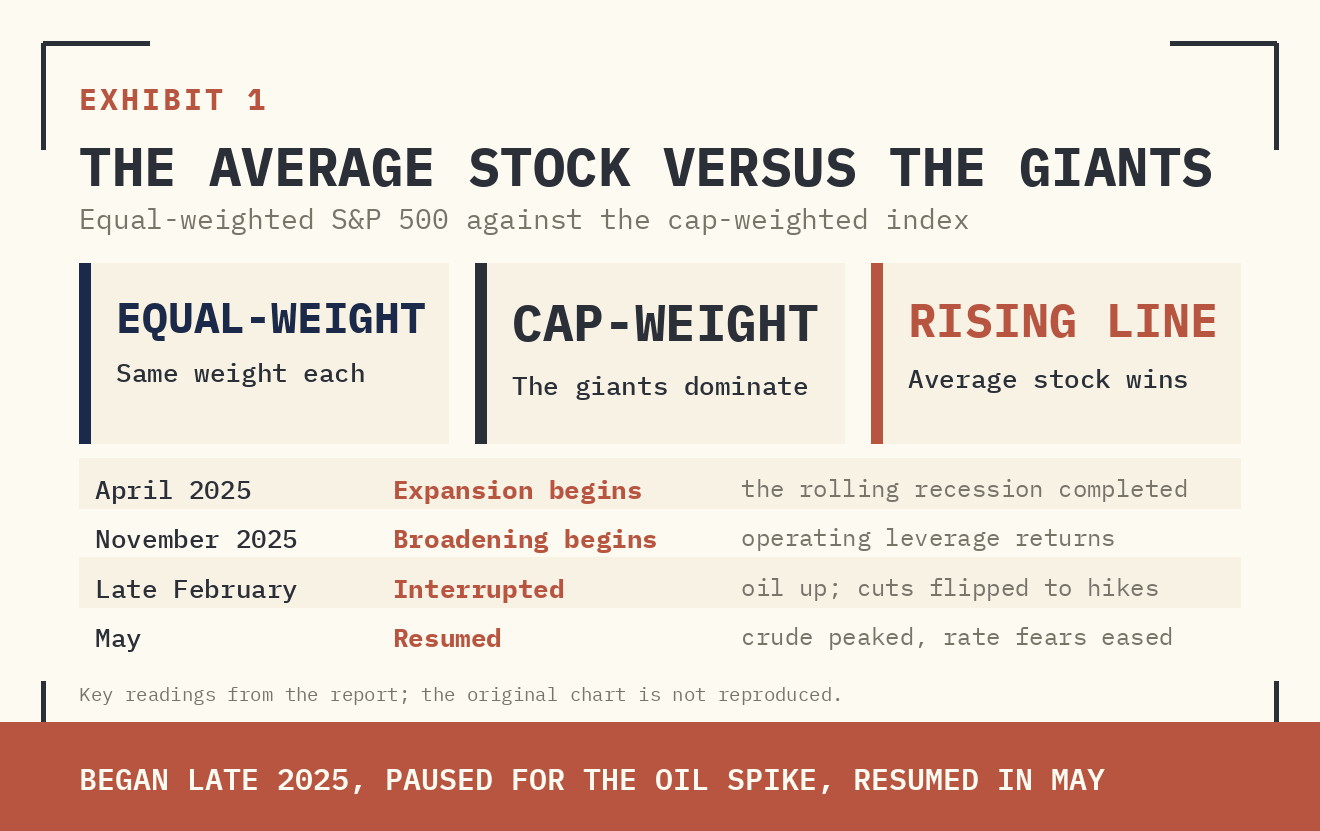
- The broadening call — the average stock beating the giants — dates to November 2025, was interrupted by the Iran war, and is back in gear now that oil has peaked and rate fears have eased.
- Semiconductors have hit peak rate-of-change in earnings revisions; the fourth correction of the AI cycle is underway, led by memory, with silver-mining stocks as the four-month-leading template.
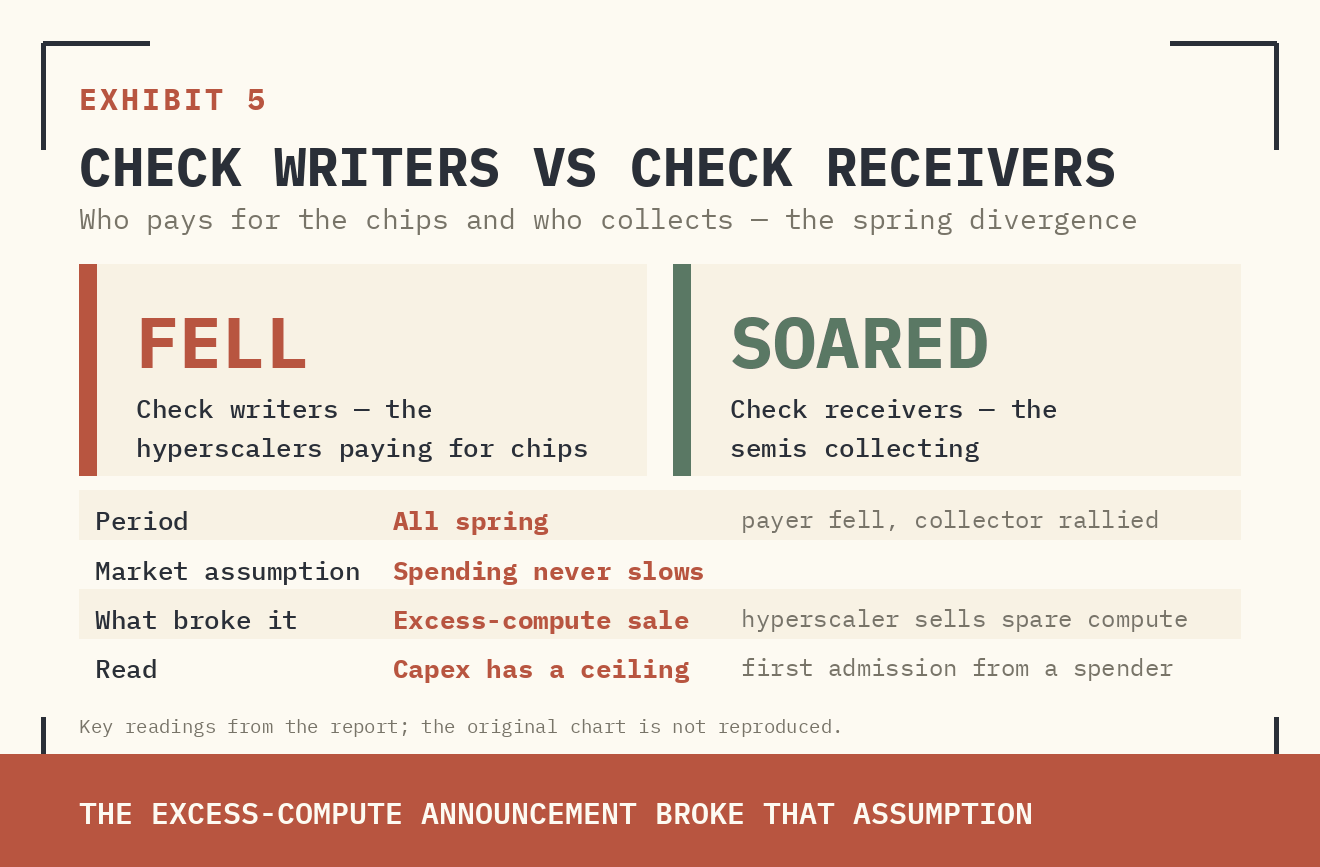
- Meta's decision to sell excess compute is the first hyperscaler admission that capex growth can bend — relief for the spenders, pressure on their suppliers.
- Hyperscalers over semis is the core near-term switch: the platforms have already underperformed, own the agentic layer, and hold a cost-cutting lever the chip complex lacks.
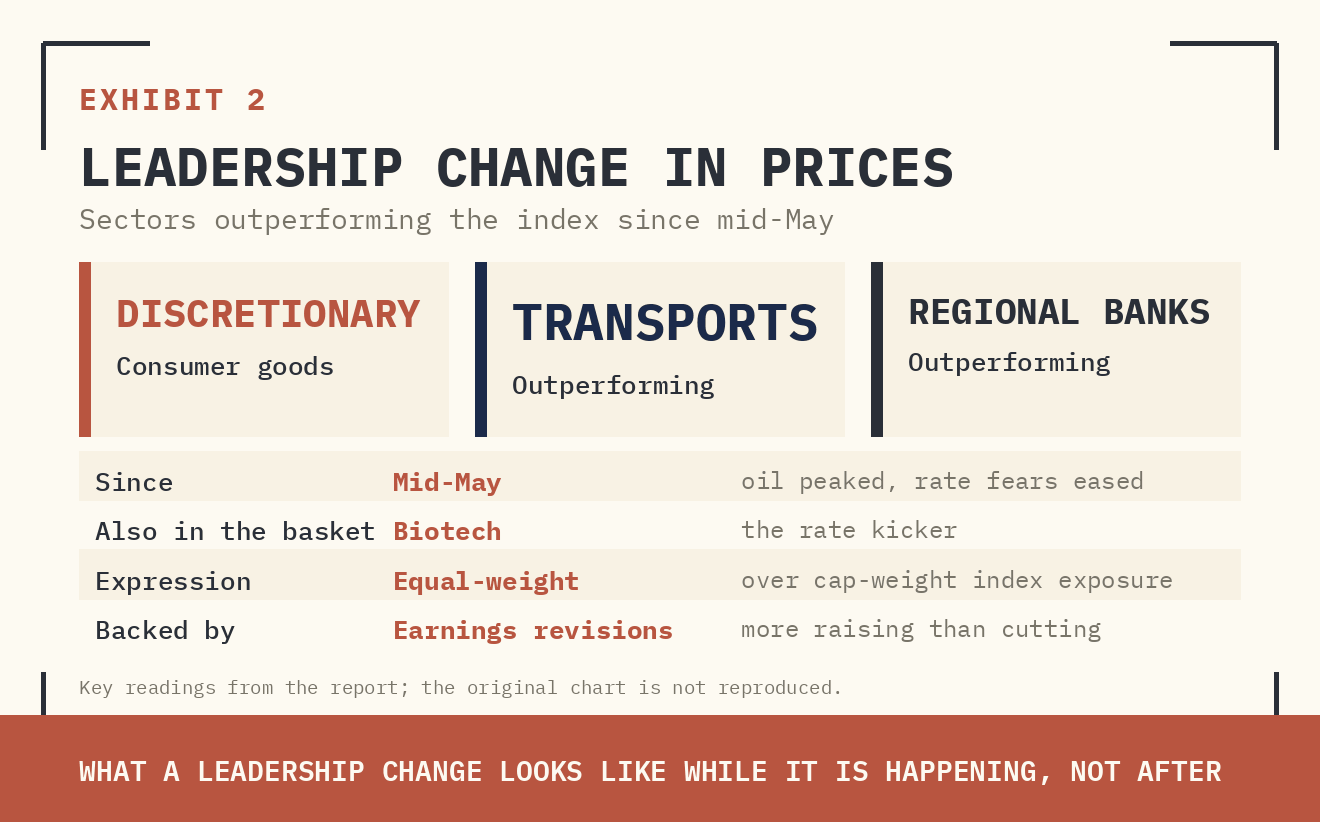
- The broadening basket: consumer discretionary goods (best risk-reward), transports, regional banks, and biotech — expressed equal-weight over cap-weight — all resting on a Fed that holds.
I. The Call and Its History
Morgan Stanley's broadening thesis is not a reaction to last week's tape — it is a call first made in November 2025 as part of the bank's 2026 outlook, built on a single structural view: the US economy completed a rolling recession in April 2025 and entered a new expansion. In new expansions, earnings growth beats expectations because revenue returns to companies that spent the downturn cutting costs — classic operating leverage — and it returns broadly, not just to the giants.
The market began anticipating exactly that from November. Then the Iran war intervened in late February: oil surged, market pricing for Fed cuts flipped to hikes, and the broadening collapsed back into the narrowest AI-capex leadership — semiconductors above all. The call was reiterated in the mid-May outlook on the view that oil had peaked and would fall significantly. Oil peaked. The broadening resumed. That is where the story stood entering July.
Supplied archive exhibit · original publication context.
Supplied archive exhibit · original publication context.
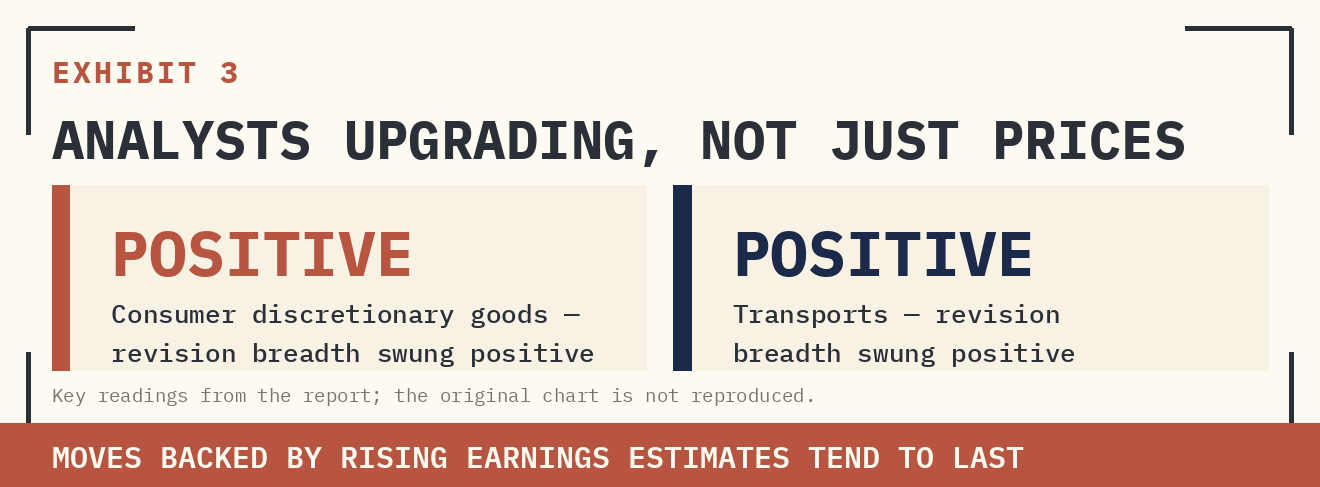
Critically, the rotation is backed by earnings estimates, not just price. Revision breadth — the share of analysts raising forecasts versus cutting them — has swung positive for consumer discretionary goods and transports. Rotations built on revisions have staying power; rotations built purely on positioning do not.
Supplied archive exhibit · original publication context.
II. Why Semis Break Here
The semiconductor trade lost momentum after a historic run from the end of March, and the strategist's diagnosis is precise: peak rate of change in earnings revisions breadth. Not peak earnings, not peak cycle — peak acceleration. Markets pay for acceleration; when the second derivative rolls, the most crowded expression corrects even while the fundamentals keep growing. The post-Micron-earnings underperformance put the diagnosis on the tape.
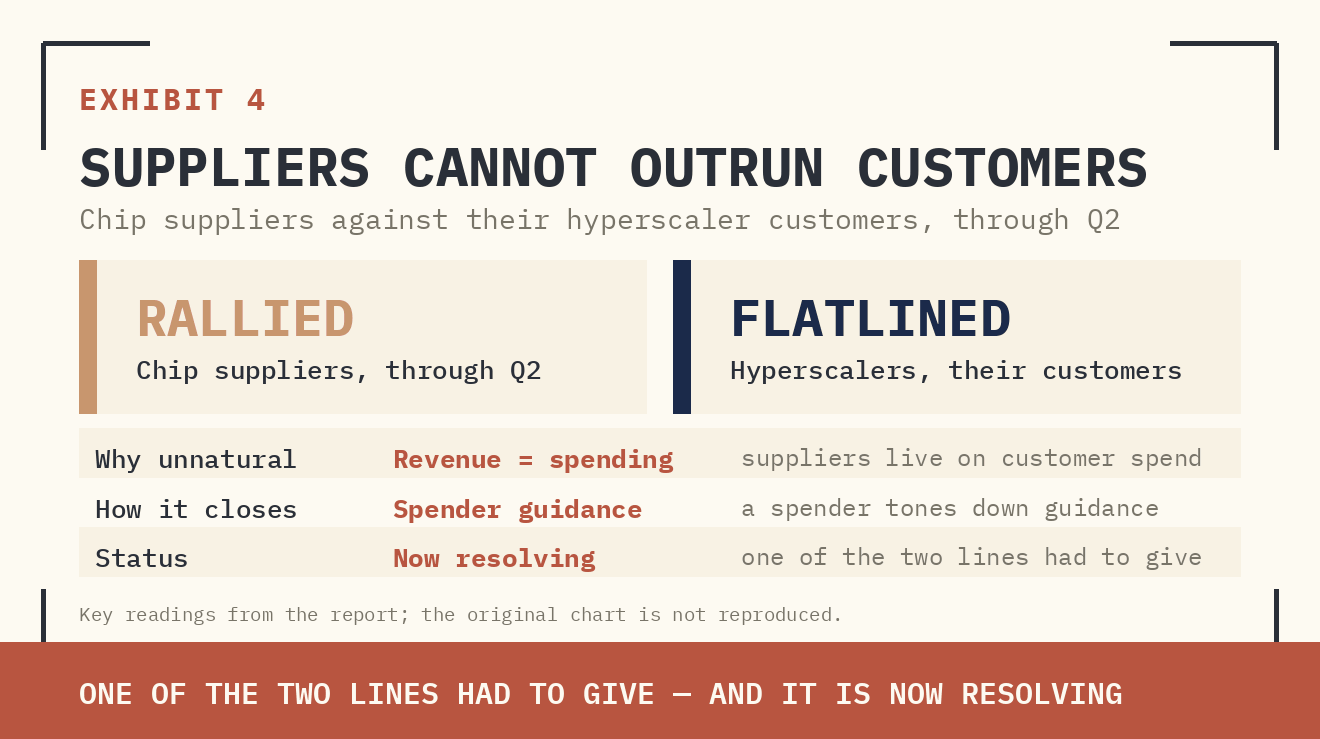
Two structural charts explain why the correction is likely to run further and why memory leads it. First, the divergence between the hyperscalers and the semis had reached an unsustainable extreme — the suppliers rallying vertically while their only customers flatlined.
Supplied archive exhibit · original publication context.
Supplied archive exhibit · original publication context.
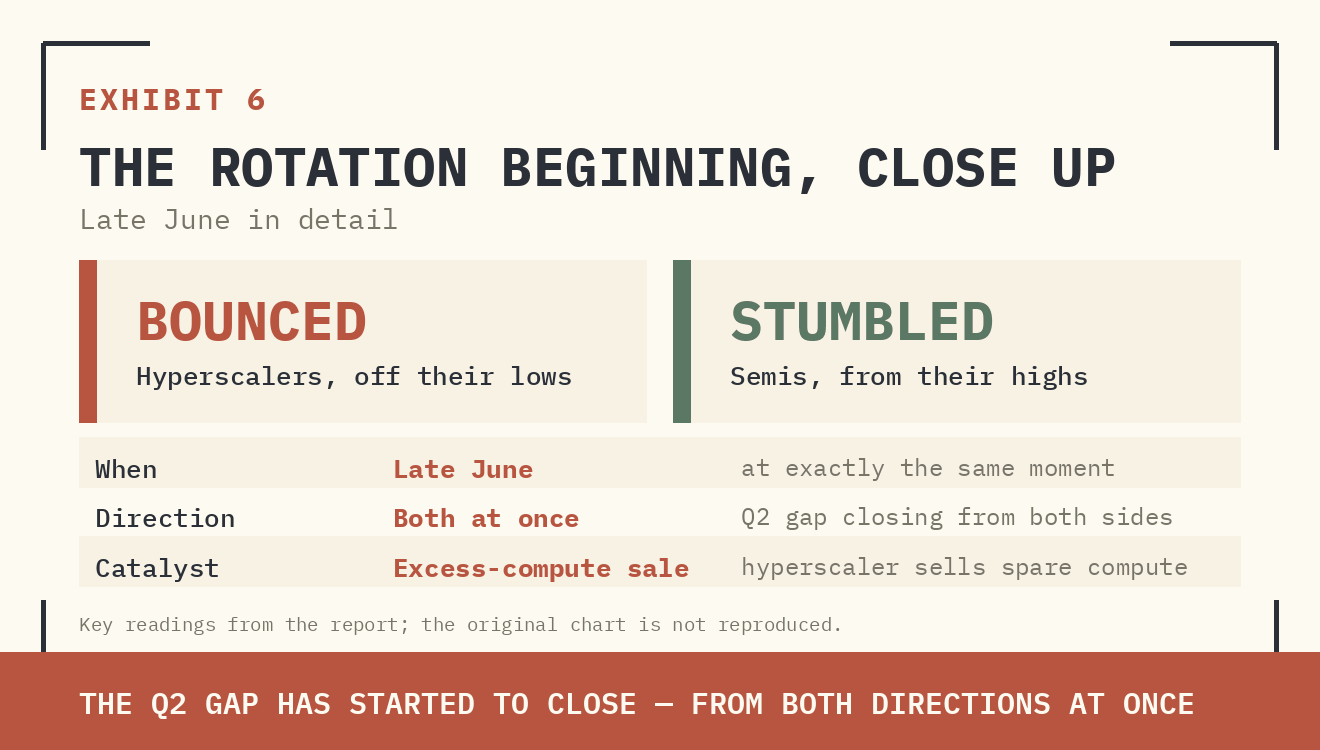
Meta supplied the reconciliation catalyst by announcing it would sell excess compute capacity to outside customers — the first hyperscaler to publicly signal that its capex trajectory has a ceiling. These divergences historically close when a spender tones down guidance or changes direction. That is now happening, and it is visible in the tape from both sides.
Supplied archive exhibit · original publication context.
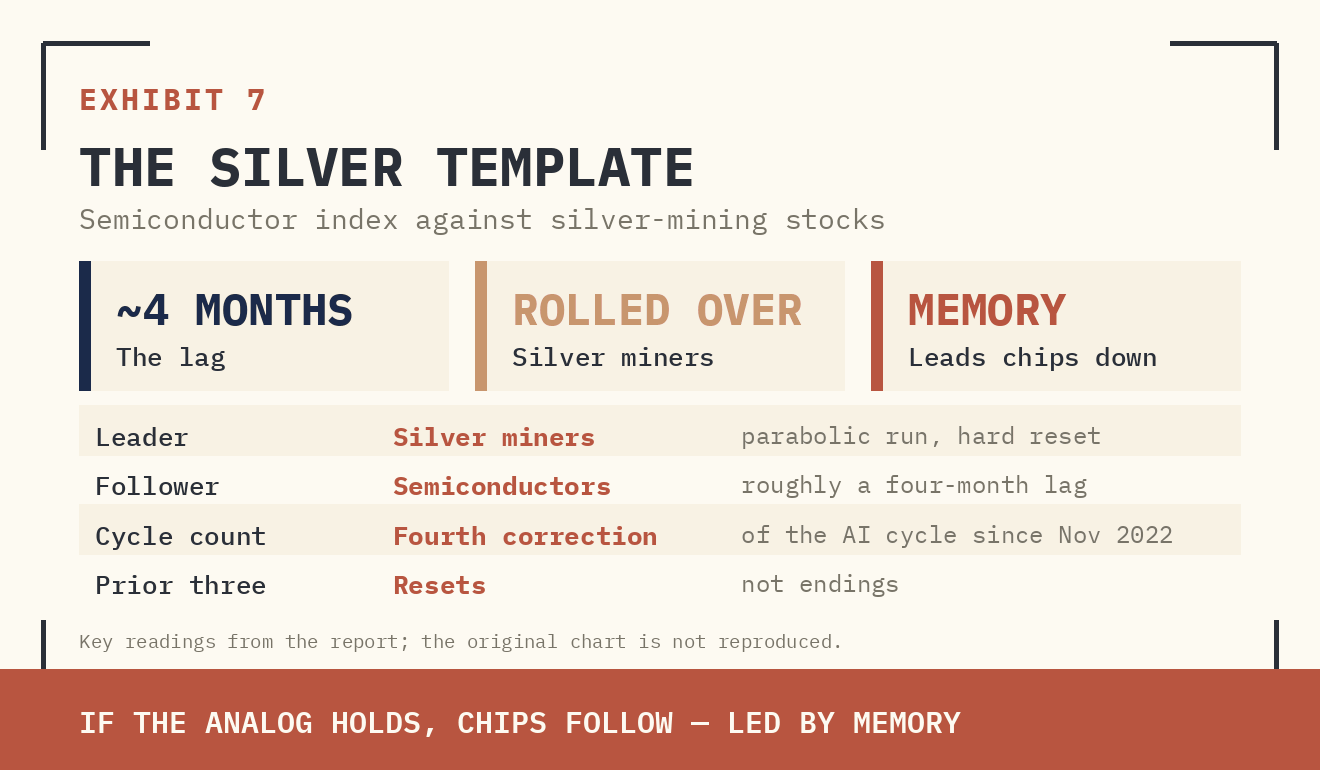
Second, the silver analog. Semis this year traded like silver-mining stocks did earlier — both parabolic, both ultimately commodity businesses with wide price swings. Silver stocks led by roughly four months and have already corrected hard. The analog, first flagged in early June, appears to be in gear — and it points at memory, the most commodity-like corner of the semiconductor complex, as the leader of the downside.
Supplied archive exhibit · original publication context.
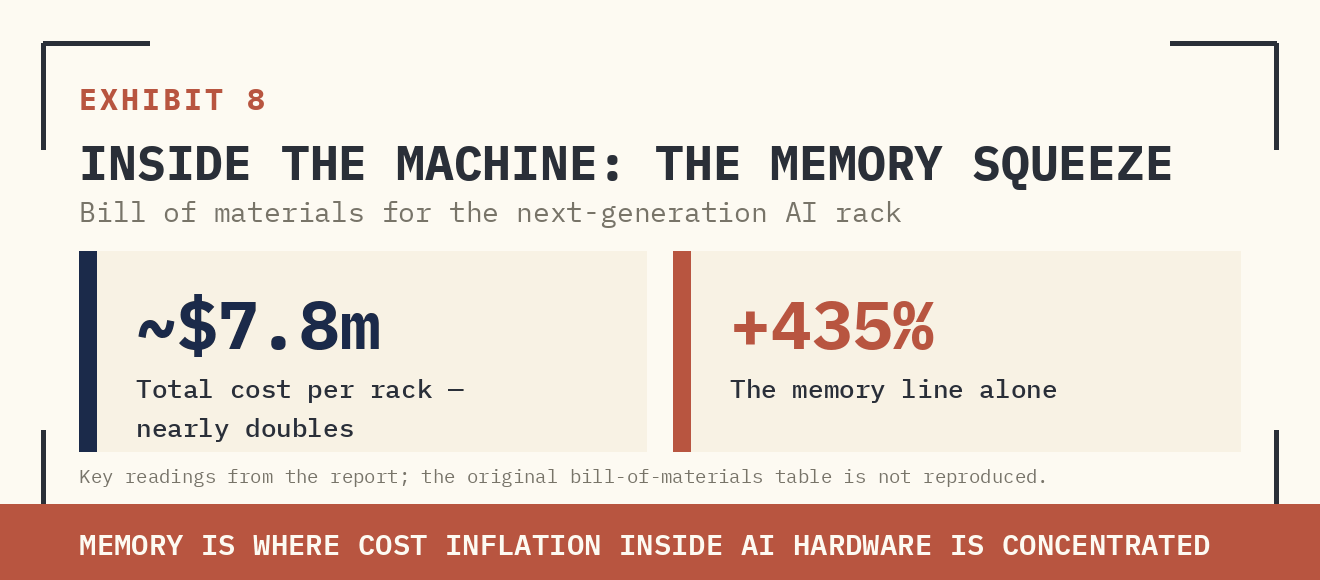
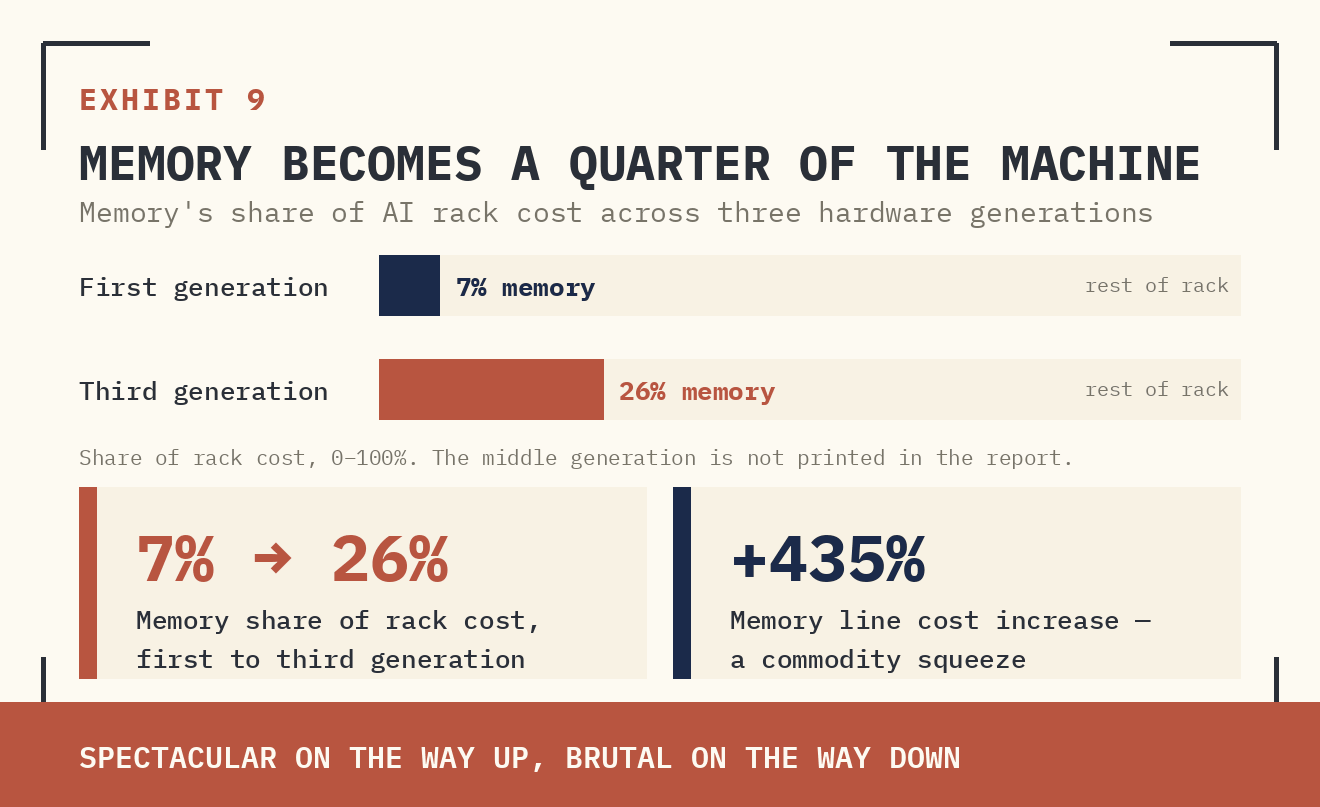
Memory's exposure is structural, not sentimental. On Morgan Stanley's hardware estimates, memory rises from 7% of AI rack cost to 26% across three generations — a 435% cost increase in a single component line. That is a commodity squeeze inside a machine, and commodity squeezes resolve violently in both directions.
Supplied archive exhibit · original publication context.
Supplied archive exhibit · original publication context.
This is the fourth correction of the AI cycle since November 2022. The first three resolved as resets. The trade is the rotation inside the reset, not the end of the cycle.
Figure 01 · Qualitative comparison
Three signals of a rotation
| Signal | What it says | What it does not prove |
|---|---|---|
| Relative prices | Leadership has shifted over a chosen window | The shift will persist |
| Earnings revisions | Analysts are changing expectations | Profits have already been delivered |
| Policy assumptions | A plausible macro pathway | The central bank will follow it |
III. The Rotation Map
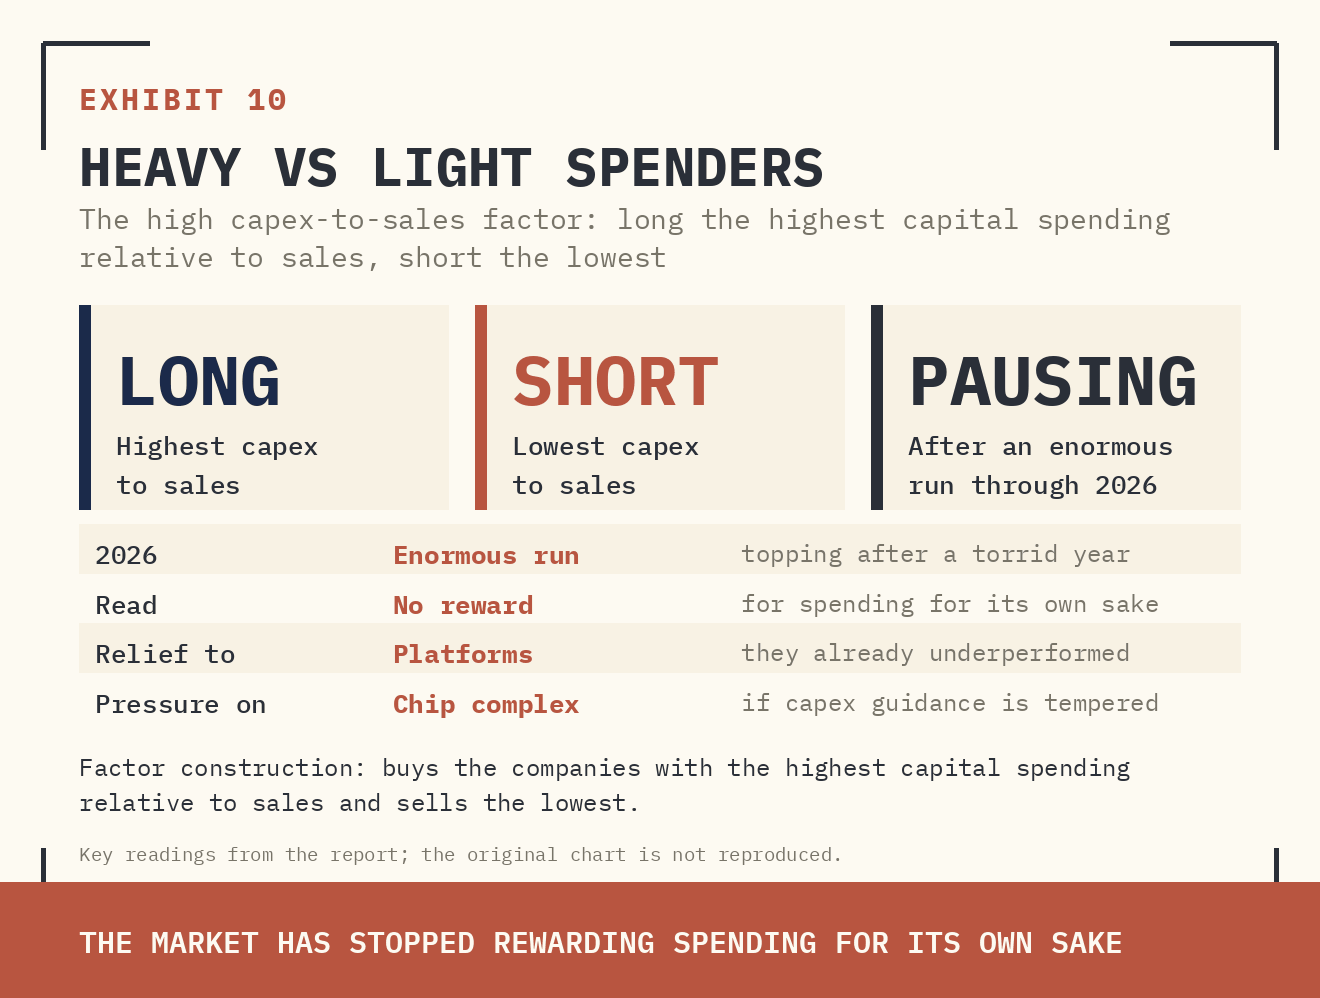
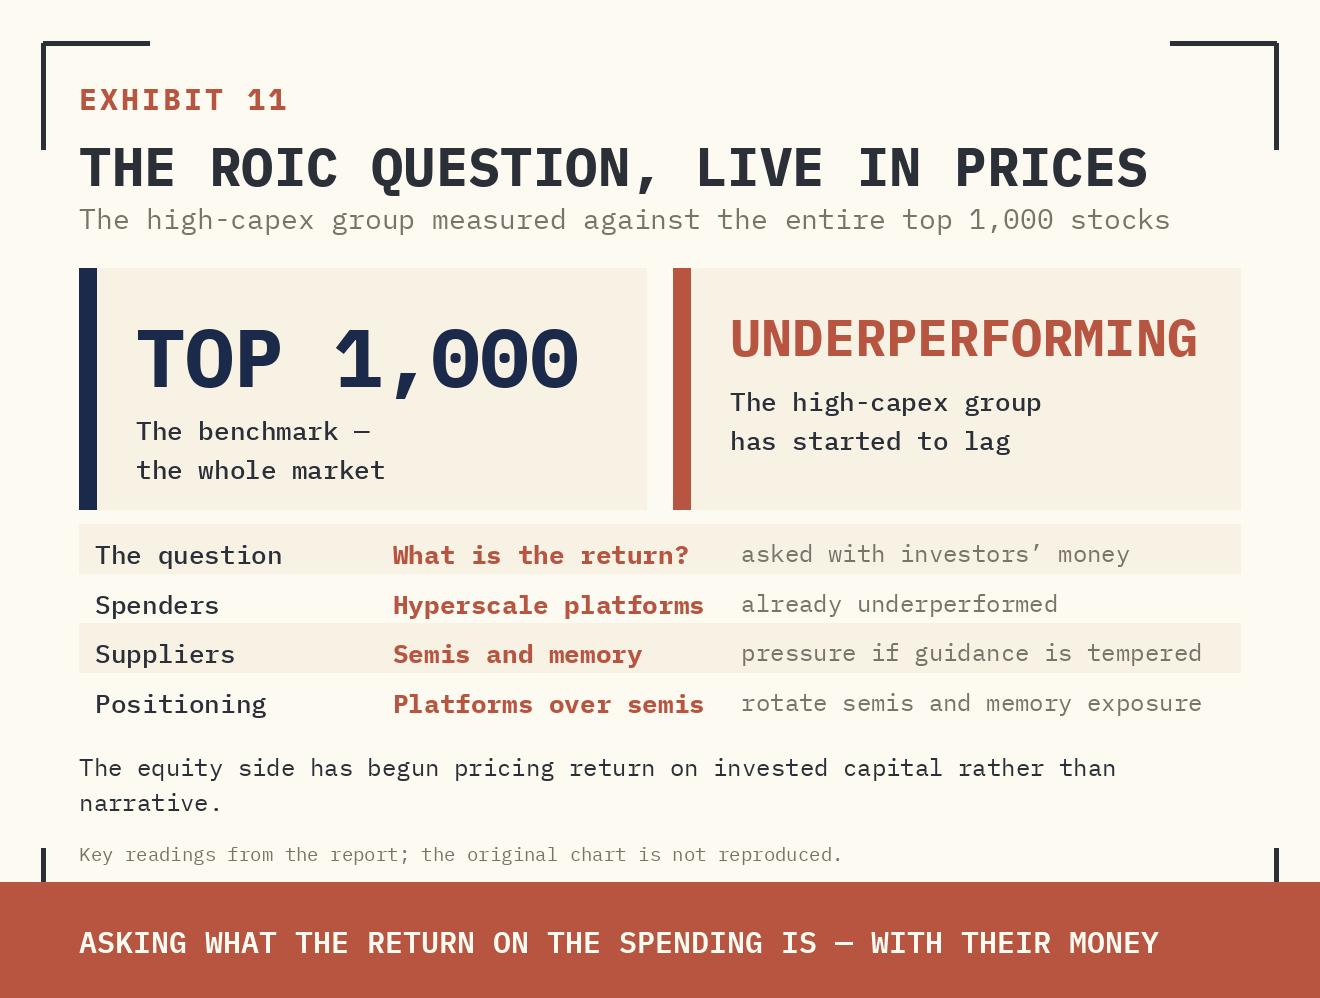
Hyperscalers over semis is the core switch. The platforms have already absorbed their underperformance as capex expectations ramped against them; the high capex-to-sales factor is topping after a torrid year; and any tempering of capex guidance from here transfers relief to the spenders and pressure to the suppliers. The platforms also carry optionality the chip complex does not: strong core businesses, leadership of the agentic application layer, and an underappreciated cost-cutting lever.
Supplied archive exhibit · original publication context.
Supplied archive exhibit · original publication context.
The broadening basket. Consumer discretionary goods is the single most compelling expression — wallet share is shifting from services back to goods, goods pricing is improving, and revisions are strong — followed by transports and regional banks. All of it implies equal-weight over cap-weight, at the index level and within each sub-sector.
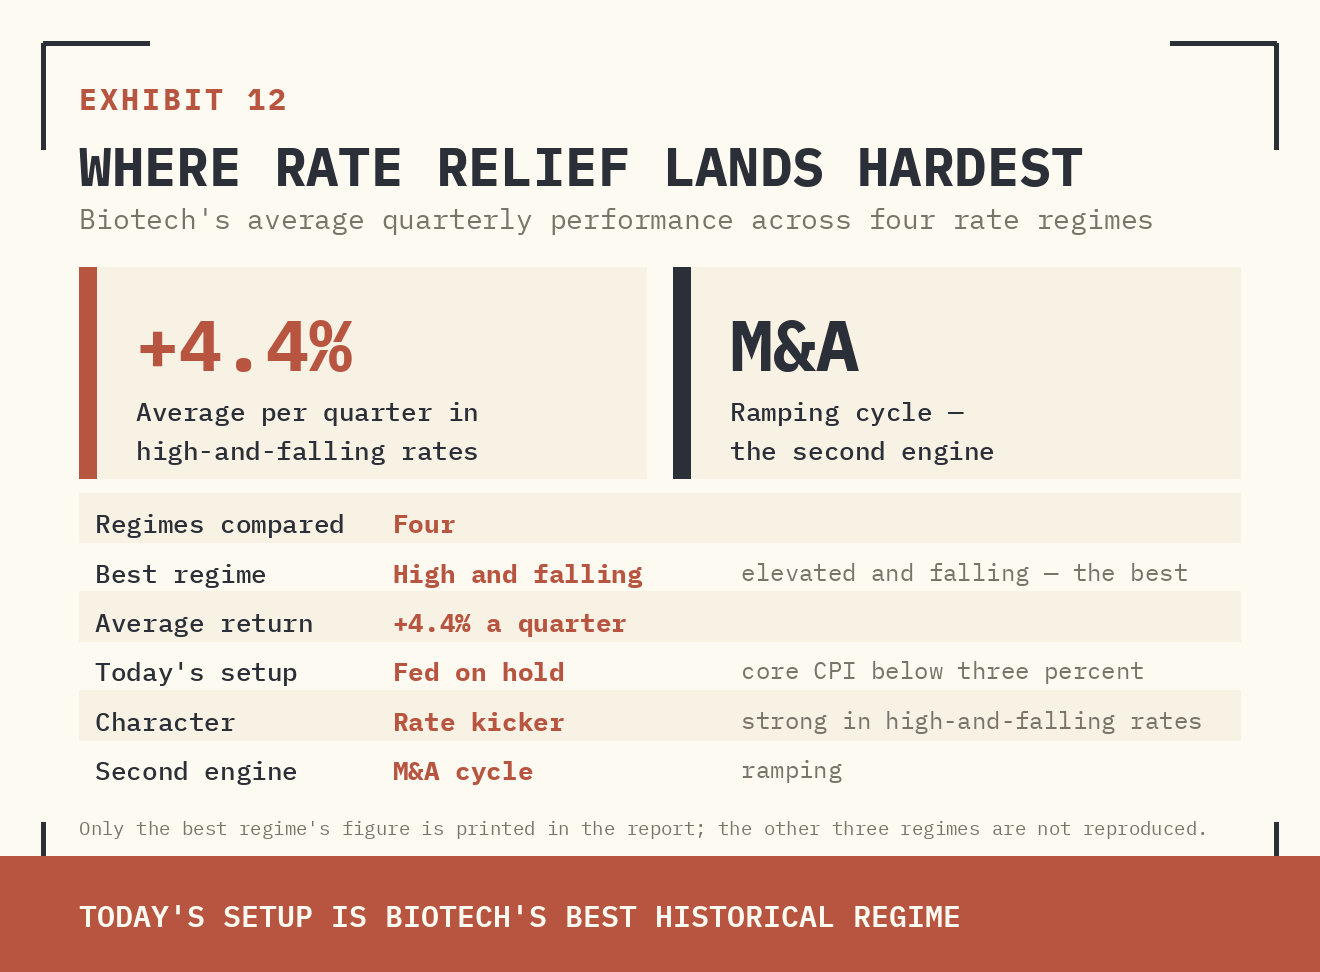
Biotech is the rate kicker. One of the most rate-sensitive groups in the market, biotech historically performs best in exactly today's regime — rates elevated and falling — and a ramping M&A cycle adds a second engine. With the house view that core CPI stays contained below three percent and the Fed holds, the risk/reward is attractive even after the group has begun to move.
Supplied archive exhibit · original publication context.
IV. The Fed Assumption
The whole construction rests on one macro assumption: the Fed does not hike this year. The June FOMC delivered two durable messages — forward guidance is being retired, and the reaction function now keys on inflation, not the dot plot. With energy falling, tariff-related inflation peaking, and services and housing inflation contained, the house view is a hold. The bond market still prices roughly one and a half hikes; if the hold materialises, that pricing unwinds — a positive surprise delivered straight to rate-sensitive equities. Chair Warsh's Sintra remark that inflation risks have come down, alongside renewed emphasis on the employment mandate and a visibly weaker payrolls print, all lean the same way.
V. Position
SLEEVE | SECTOR-LEVEL POSITION | HORIZON | DRIVER |
|---|---|---|---|
Core switch | Rotate semiconductor and memory exposure into hyperscale platform exposure. | Near term | Revisions peak / capex guidance |
Broadening | Overweight consumer discretionary goods (best risk-reward), transports, regional banks; equal-weight over cap-weight. | H2 2026 | Operating leverage / oil peak |
Rate kicker | Overweight biotech — best historical regime (high-and-falling rates) plus M&A ramp. | H2 2026 | Fed hold / contained CPI |
Avoid | Chasing memory and the momentum basket; the silver analog says the correction has further to run. | 3–6 months | Commodity reset dynamics |
This desk note accompanies the consolidated Buy Side Lens report "Built Like a Railway, Priced Like Software" (BSL-018, 07 July 2026), which carries the comparison against the macro view.


