
Original Lens and publication context
A US-Israel war with Iran has closed the world's most critical energy artery. SPR releases, export controls, and diplomatic jawboning will not fix a flow problem. This report maps the macro consequences — and what it means for India.
- A flow problem, not a stock problem: 20 mb/d transit Hormuz, Gulf producers have cut up to 6.7 mb/d, and the estimated hit to Gulf exports is near 17 mb/d, 17 times the 2022 Russia loss. WTI swung between $81 and $120 in 72 hours.
- Reserves cannot fix it: the OECD holds 1,247 mb but the feasible coordinated release is about 1.2 mbd, roughly 7.5% of the shortfall and only after a two-week lag. The US SPR sits near 415 mb, close to its lowest sustained level since the mid-1980s.
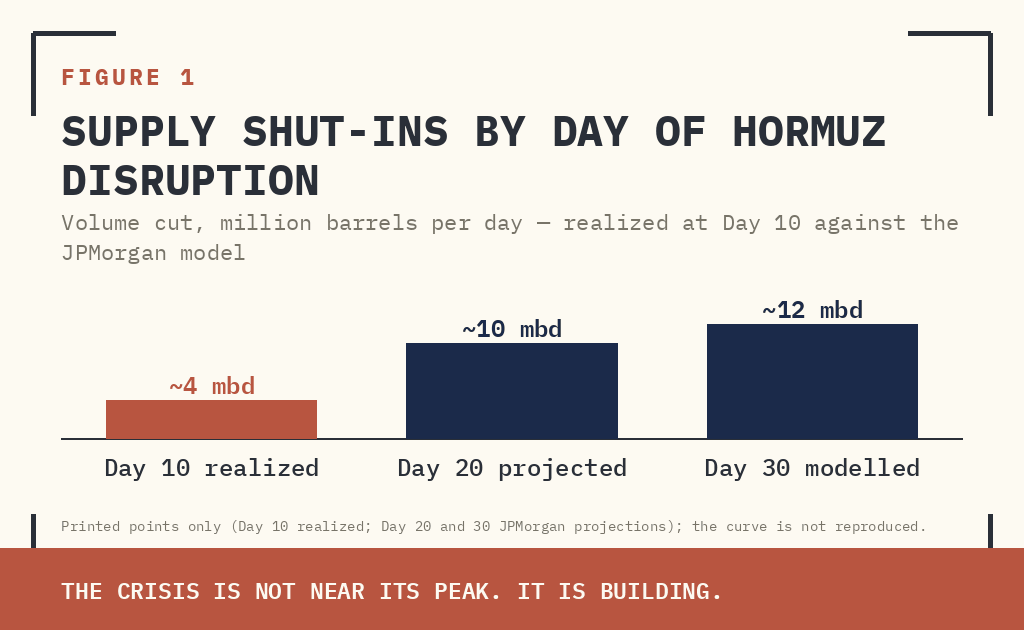
- Shut-ins accelerate: realized cuts are about 4 mbd at Day 10, roughly 10 mbd by Day 20 and 12 mbd by Day 30 as pre-war inventory buffers run out. Oil fell $6.70 in under 30 minutes on the IEA headline: it trades headlines, not fundamentals.
- The Australian dollar is the crisis haven at 71.68 US cents, the highest since June 2022, on terms of trade and a hawkish RBA, with the AU–US 10-year spread near 100 basis points; options give 75 cents a 33% chance within three months.
- India imports about 85% of its crude, nearly 60% from the Gulf, with roughly 9.5 days of strategic cover against the IEA's 90; refiners have bought 30 million Russian barrels at $2–8 premiums to Dated Brent, but the largest state bank will not finance them.
I. THE SITUATION: A FLOW PROBLEM, NOT A STOCK PROBLEM
US and Israeli strikes on Iran have triggered the effective closure of the Strait of Hormuz — the 33-kilometre chokepoint through which approximately 20 million barrels per day of crude and petroleum products normally transit. Saudi Arabia, Iraq, the UAE, and Kuwait have collectively slashed output by as much as 6.7 million barrels per day, representing roughly 6% of global oil supply. Ships are being attacked. GPS signals are being jammed. Tankers are stalled in place, unable to load or depart.
The supply shock that has resulted is categorically different from the 2022 Russia disruption. Russia's peak production loss was approximately 1 million barrels per day. The current estimated hit to Persian Gulf exports stands near 17 million barrels per day — 17 times larger. WTI crude has swung between $81 and $120 within 72 hours, with oil volatility breaching 103, levels last seen during the Kuwait War.
Supplied archive exhibit · original labels. Read alongside the editorial corrections.
The shut-in escalation curve above is arguably the most important chart in this report. JPMorgan's modelling distinguishes between crude-only volume cuts (gold line) and total crude-plus-products cuts (blue line), plotted against realized data (red). As of Day 10 — where the conflict currently stands — realized shut-ins are tracking broadly in line with the JPM crude forecast at approximately 4 mbd. But the trajectory from here is unambiguous: if the closure extends to Day 20, JPM projects total shut-ins approaching 10 mbd. By Day 30, the model reaches approximately 12 mbd on a crude-and-products basis. Each additional day the strait remains closed does not add a fixed increment of damage — it accelerates the damage curve as pre-positioned cargoes are exhausted and new loading programs fail to materialize.
The realized line (red) hugging the lower crude-only forecast through Day 10 is not reassuring — it simply reflects the lag between the strait closure and the physical arrival of feedstock shortages at refineries. Refiners in Asia are currently consuming pre-war inventory buffers. Those buffers have a finite duration. When they are exhausted — at different rates across Japan, South Korea, Taiwan, India, and Thailand depending on days-of-cover — the realized line will accelerate sharply toward the blue forecast. The crisis is not near its peak. It is building.
II. THE POLICY TOOLKIT — AND ITS LIMITS
Governments have activated every standard lever in the playbook. JPMorgan's commodity-research desk has mapped six policy options and their constraints:
OPTION | MECHANISM | VERDICT |
|---|---|---|
SPR Release | IEA proposing >182 mb coordinated release; US SPR at 415 mb (58% capacity) | 1.2 mbd feasible vs 16 mbd shortfall. Insufficient. |
Export Restrictions | IEEPA authority to ban US crude/product exports (~4 mbd); traps domestic supply | Short-term domestic relief; long-term discourages drilling, tightens global supply |
Jones Act Waiver | Allow foreign tankers between US ports; amplifies SPR effectiveness | Useful complement to SPR. Limited standalone impact. |
Federal Tax Waiver | 18.4¢/gal gasoline, 24.4¢/gal diesel; requires Congressional action | Political hurdle high. Marginal pump-price relief only. |
E15 Blending Rule | EPA waiver allows higher ethanol blend in summer; expands gasoline pool modestly | Modest. Fastest to implement. |
RVP Waiver | Allow winter-grade gasoline in summer; faster than blending rule change | Few cents/gallon relief. Better than E15 alone. |
Why the SPR Release Cannot Work: The Arithmetic of a Flow Crisis
The SPR release proposal commands headlines but fails on first-principles analysis. Strategic petroleum reserves exist to address stock dislocations — sudden drawdowns in inventory that create a temporary price spike until supply routes normalize. The Hormuz closure is categorically different: it is a flow disruption. Approximately 16–17 million barrels per day that would normally transit the strait simply cannot move. No amount of inventory release can substitute for physical cargo that cannot be loaded, shipped, or delivered.
Supplied archive exhibit · original labels. Read alongside the editorial corrections.
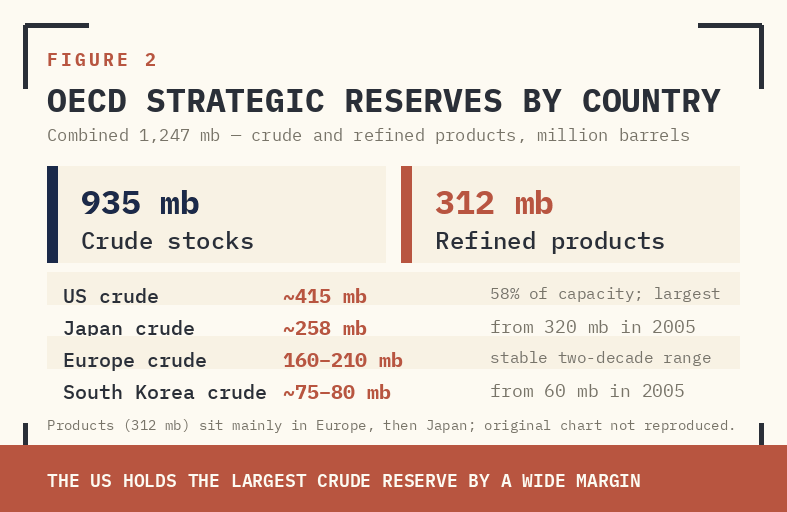
The OECD collectively holds 1,247 million barrels in strategic reserves — 935 mb of crude and 312 mb of refined products. On paper, this looks substantial. The US dominates the crude component at approximately 415 mb, with Europe, Japan, and South Korea contributing the balance. The product reserves — 312 mb — are spread primarily across Europe and to a lesser extent Japan, reflecting historical policy choices around refinery security. The critical observation from Figure 1 is concentration: the US holds the single largest crude reserve by a wide margin, meaning any coordinated release is structurally dependent on US political will and US withdrawal capacity. If either is constrained — and both are — the entire G7 release programme shrinks accordingly.
Supplied archive exhibit · original labels. Read alongside the editorial corrections.
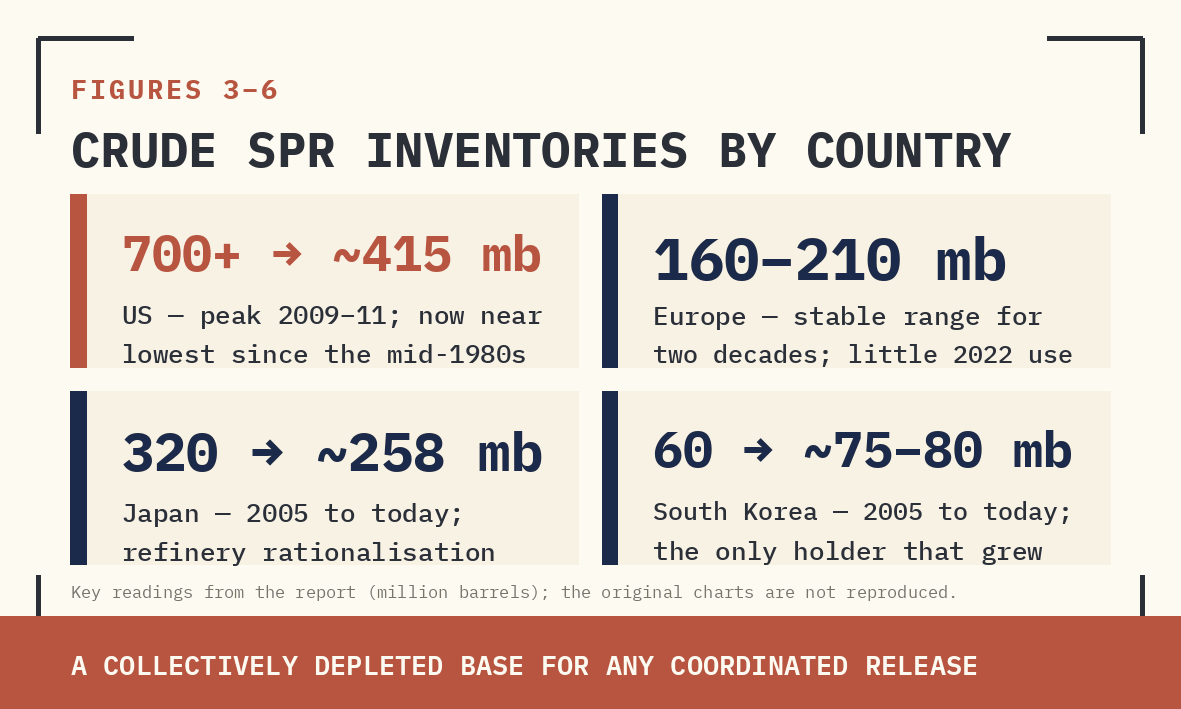
The four country-level SPR charts reveal a structural deterioration that aggregate numbers obscure. The US reserve (top left) peaked above 700 mb in the 2009–2011 period and has been in secular decline since 2011 through a combination of congressional mandated sales and emergency drawdowns. The 2022 Biden release is visible as a sharp cliff edge, dropping the reserve to multi-decade lows before a modest partial rebuild. At ~415 mb today, the US SPR is still near its lowest sustained level since the mid-1980s.
Europe (top right) tells a different story: inventories have been broadly stable in the 160–210 mb range for two decades, with limited drawdown even in 2022 — reflecting both smaller absolute size and greater political reluctance to deplete reserves that serve a domestic energy-security function. Japan (bottom left) shows a long structural decline from 320 mb in 2005 to approximately 258 mb today, a consequence of refinery rationalization and demand contraction. South Korea (bottom right) has expanded its reserve from 60 mb in 2005 to ~75–80 mb currently — the only major OECD holder that has grown its buffer over the period. Together, the four charts demonstrate that the coalition available for a coordinated release is working from a collectively depleted base, with the dominant contributor (the US) most constrained by its own 2022 drawdown.
Supplied archive exhibit · original labels. Read alongside the editorial corrections.
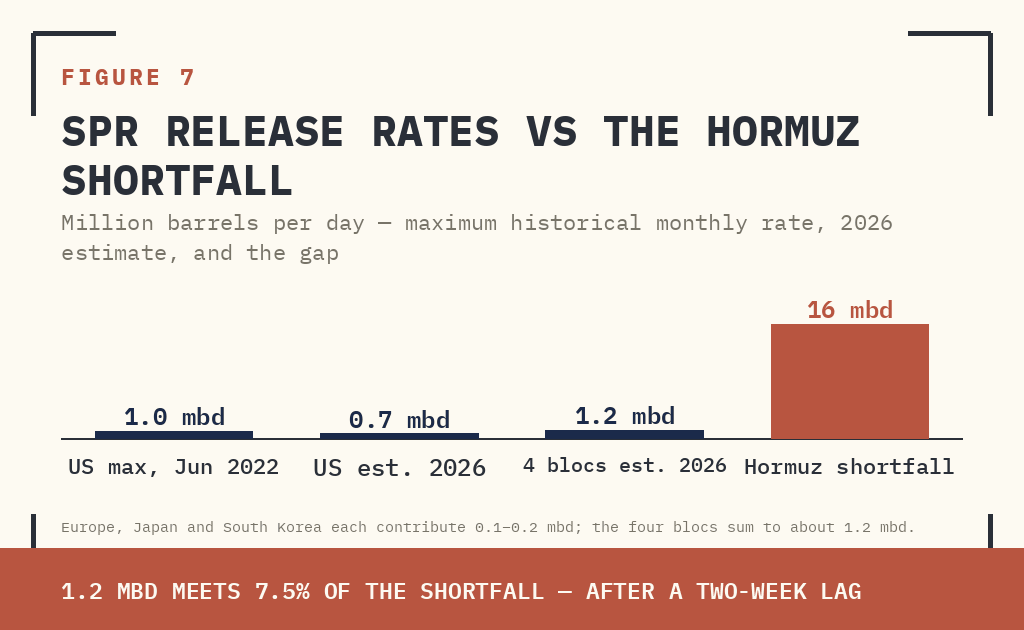
Figure 7 is where the arithmetic becomes definitive. Each country's maximum historical monthly release rate — the fastest it has ever actually drawn down its reserve — is shown alongside the 2026 estimated capacity. The US achieved its peak rate of approximately 1.0 mbd in June 2022 (pink bar), but its 2026 estimated capacity (dark bar) is materially lower at roughly 0.7 mbd, reflecting the depleted inventory and cavern integrity constraints discussed above. Europe, Japan, and South Korea each contribute release rates in the 0.1–0.2 mbd range — meaningful at the margin but rounding errors against a 16 mbd shortfall.
Summing the 2026 estimated rates across all four participating blocs yields approximately 1.2 mbd — the figure JPMorgan cites as the feasible coordinated ceiling. This is not a pessimistic assumption; it is derived from the historical maximum each country has ever achieved, adjusted downward for lower current inventories. The gap between 1.2 mbd and a Hormuz shortfall of 16 mbd (12 mbd on the Day-30 shut-in model) is not a policy failure — it is a physical impossibility. Western strategic reserves were designed and scaled for disruptions of 1–3 mbd lasting weeks. They were never architected for a chokepoint closure of this magnitude.
The bottom line from JPMorgan is unambiguous: all listed measures will have limited impact on oil prices unless safe passage through the Strait of Hormuz is assured. The US Navy has not yet announced a convoy escort program. Mine-clearing operations have not begun. The USS George H.W. Bush carrier group could reach the theatre in 10–12 days. French carrier Charles de Gaulle arrived in Cyprus. President Macron has stated escort missions are feasible only once the most intense phase of hostilities passes — effectively when the war is over.
III. MARKET SIGNALS: WHAT PRICES ARE SAYING
ASSET / MARKET | SIGNAL | IMPLICATION |
|---|---|---|
WTI Crude | $81–$120 range in 72 hrs; current ~$84 | Extreme uncertainty premium; market cannot price duration of closure |
Oil Volatility (OVX) | Surged above 103 | Kuwait War-era stress; hedging costs prohibitive for importers |
Brent Crude | ~$88, touched near $120 on Mon | Asian refiner feedstock premium blowing out |
Australian Dollar (AUD) | 71.68 US cents — highest since Jun 2022; 35-yr high vs JPY; Citi target 75¢ in 3 months | Top-performing G10 currency YTD. RBA hike >70% priced for Mar 17. AU-US yield spread widest since Oct 2022. Energy exporter terms-of-trade windfall inverting traditional safe-haven flows. |
Japanese Nikkei / JPY | Under pressure; BOJ forced to hike | Energy import cost = inflation = rate hike = wealth effect reversal |
US Equities / S&P; Futures | Rose on IEA SPR news; then whipsawed | Market trading headlines not fundamentals; fragile risk sentiment |
NASDAQ / VXN | VXN in panic mode; NASDAQ near key support | Rate expectations + energy shock = dual risk for growth assets |
Market Microstructure: How Oil Responded to the IEA Announcement
Supplied archive exhibit · original labels. Read alongside the editorial corrections.
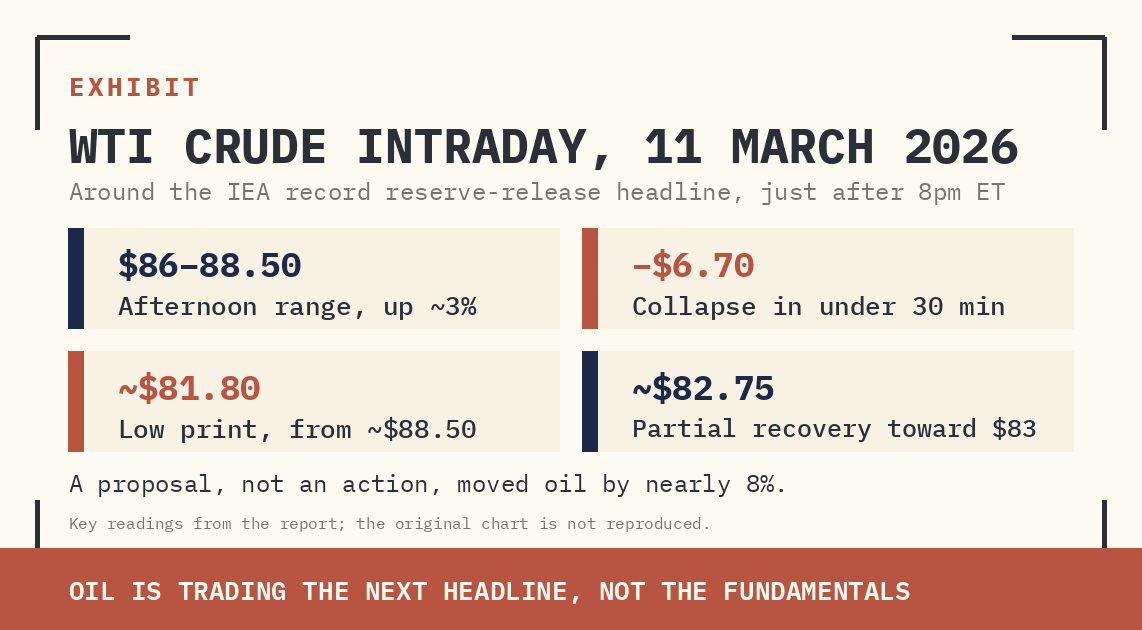
The intraday WTI chart above captures the market's immediate reaction to the IEA's proposed record reserve release, reported just after 8pm ET on March 11. The price action is instructive on multiple levels. Oil had been trading between $86 and $88.50 through the afternoon session, holding gains of nearly 3% on the day. The headline triggered an immediate $6.70/barrel collapse in under 30 minutes — from approximately $88.50 to $81.80 — before a partial recovery toward $82.75 as the market began to digest the operational limitations of the proposal.
Three observations from this price action matter for macro analysis. First, the speed of the move — 30 minutes — confirms that oil markets are trading on headline flow, not fundamental reassessment. Any credible diplomatic signal, ceasefire rumour, or naval escort announcement will produce moves of similar or greater magnitude in either direction. Positioning is extremely fragile. Second, the partial recovery from the lows — oil bouncing from ~$81.80 back toward $83 — suggests the market quickly concluded the SPR release would not materially address the physical shortfall, selling the news then buying back the dip. Third, and most importantly: a jawboning event (a proposal, not an action) moved oil by nearly 8%. An actual kinetic development — a mine strike on a tanker, or conversely a confirmed naval escort through Hormuz — would produce a price movement of an entirely different order.
III-A. DEEP DIVE: AUSTRALIAN DOLLAR — THE CRISIS HAVEN
The Australian dollar has emerged as one of the most counterintuitive beneficiaries of the Iran war. In a normal geopolitical stress event, the AUD weakens sharply — it is a high-beta, risk-sensitive currency that historically sells off against the yen and dollar when fear dominates. Not this time. The AUD has climbed to its highest level since June 2022 at 71.68 US cents and hit a 35-year high against the yen. It is the top-performing major currency year-to-date.
Two structural forces explain the divergence from historical pattern. First, Australia is a major LNG and commodity exporter — elevated oil and gas prices directly improve its terms of trade, channeling export revenue into the currency. Second, the Reserve Bank of Australia has adopted a hawkish posture, stating it will not hesitate to raise rates if the Iran conflict further stokes inflation. Swaps markets are pricing more than a 70% probability of a rate hike on March 17. The result: the AU-US 10-year yield spread has blown out to its widest since October 2022, drawing yield-seeking flows into Australian bonds and supporting the currency.
Supplied archive exhibit · original labels. Read alongside the editorial corrections.
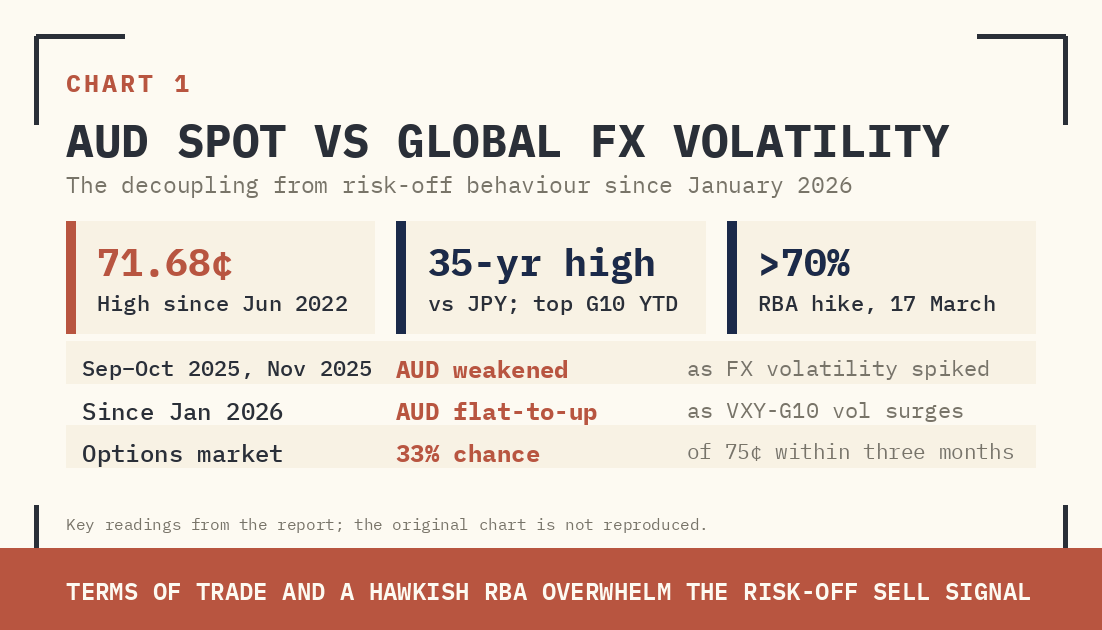
Chart 1 above illustrates the decoupling precisely. The JPM EM FX Vol VXY-G10 index — a measure of realized FX volatility — has risen sharply since January 2026 as the Iran conflict escalated. In prior stress episodes (Sep–Oct 2025, Nov 2025), AUD weakness accompanied volatility spikes. In the current episode, AUD has been essentially flat-to-up even as FX volatility surges. The terms-of-trade channel and the hawkish RBA are together overwhelming the traditional risk-off AUD sell signal.
Supplied archive exhibit · original labels. Read alongside the editorial corrections.
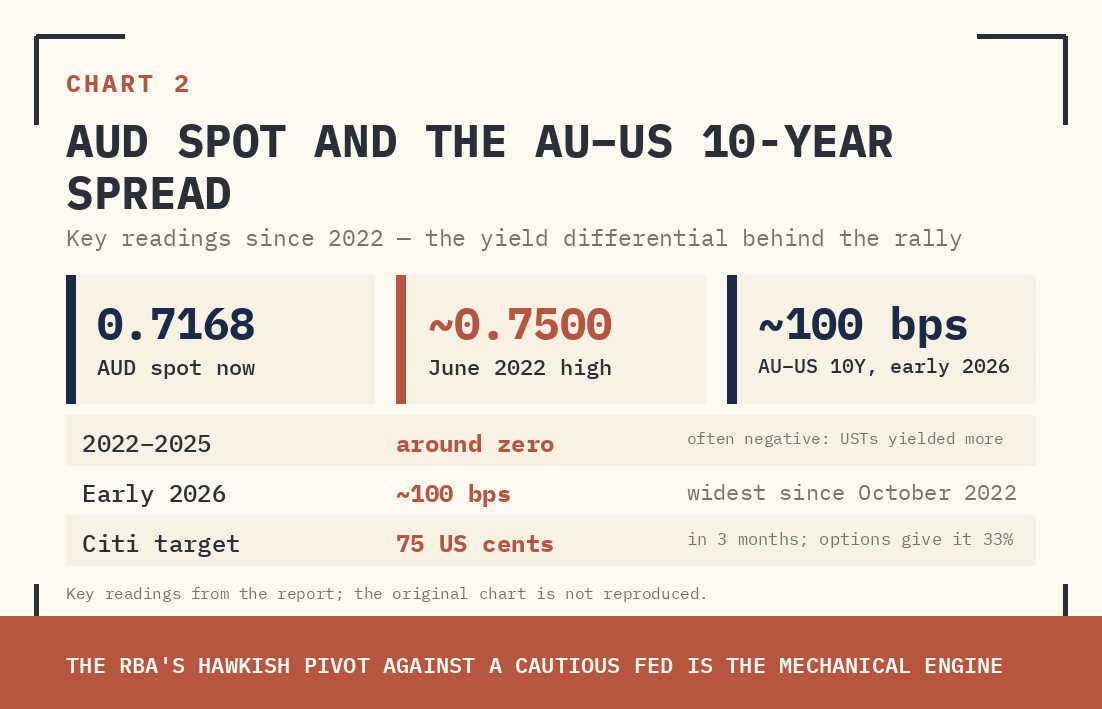
Chart 2 provides the longer structural context. For most of 2022–2025, the AU-US 10-year bond spread oscillated around zero and spent significant time in negative territory — meaning US Treasuries yielded more than Australian bonds, pulling capital toward the dollar. As of early 2026, the spread has surged to approximately 100 basis points in Australia's favor — a dramatic reversal that reflects the RBA's hawkish pivot against the Fed's more cautious stance. This yield differential is the primary mechanical engine driving AUD appreciation.
The macro implication is significant. The AUD is functioning as a commodity-war-haven — a classification that previously belonged exclusively to the Swiss franc and Japanese yen in crisis episodes. For global portfolio managers running commodity exposure, long AUD is emerging as a cleaner hedge than direct oil positions, which carry extreme volatility (OVX above 103). The options market assigns a 33% probability of AUD touching 75 cents within three months, consistent with Citi's base case.
IV. GEOPOLITICAL DYNAMICS & DIPLOMATIC SIGNALS
Messaging from Washington has been internally contradictory. Energy Secretary Chris Wright posted — then deleted — a claim that the US Navy had escorted a tanker through Hormuz. The White House corrected the record. President Trump simultaneously denied reports of Iranian mine-laying and ordered strikes on "10 inactive mine-laying boats." Defense Secretary Hegseth declared the US would "not relent until the enemy is totally and decisively defeated," while Trump's special envoy Steve Witkoff stated that diplomatic evidence "suggests no" willingness from Iran.
Iran's President Pezeshkian indicated Tehran would scale back if neighboring airspace and waters were not used to attack the Islamic Republic. Turkey intercepted an Iranian missile in its airspace, prompting NATO to increase air defenses in southeastern Turkey. The UAE's Ruwais refinery — the country's largest — halted operations after a drone strike. Saudi Arabia, Kuwait, and Bahrain continue to intercept Iranian drones.
China has hailed what it calls a "landmark year" in US ties even as it maneuvers strategically. Beijing has swiftly curbed diesel and gasoline exports to conserve domestic supply, while sitting on an estimated 1.4 billion barrels in strategic reserves — triple the US SPR on a proportional basis. With three weeks until the Trump-Xi summit, Beijing is frustrated by what it sees as insufficient US preparation, limiting the summit to trade agreements.
V. CHINA: THE STRATEGIC BUFFER
China's refiners have substantial breathing room. Commercial onshore crude inventories stand at a record 851 million barrels. Visible strategic inventories add another 413 million barrels, with total estimates as high as 1.4 billion barrels including underground cavern storage. Russia, elevated above Saudi Arabia as China's top supplier, provides a sanctions-insulated pipeline alternative. Brazilian barrels have roughly doubled in share since 2021. Domestic output has climbed to a record.
Southern Chinese refineries — more dependent on seaborne supply — are cutting run rates by a median of 8 percentage points. Northern refineries, backed by domestic crude and Russian pipeline inflows, are materially better positioned. Beijing has introduced a legal requirement for companies to hold emergency reserves that authorities can draw on — a supply-security architecture purpose-built for precisely this scenario.
China will not participate in the IEA SPR release. Its strategic insulation, combined with access to sanctioned Russian and Iranian barrels, places it in a relative geopolitical advantage as the West depletes its own emergency stocks.
INDIA SPECIAL ANALYSIS
How the Strait of Hormuz Crisis Hits India — And What India Must Navigate
Structural Exposure
India is the world's third-largest oil consumer and imports approximately 85% of its crude oil requirements. Nearly 60% of those imports originate in the Gulf — Saudi Arabia, Iraq, UAE, and Kuwait together. Every one of those suppliers has cut output by 6.7 million barrels per day collectively. Every one of those cargoes transits the Strait of Hormuz. India's feedstock supply chain is, for the moment, severed at the source.
India does not possess a strategic petroleum reserve of meaningful scale. The Strategic Crude Oil Reserve maintained by Indian Strategic Petroleum Reserves Ltd (ISPRL) holds approximately 5.33 million metric tonnes across three underground facilities — Visakhapatnam, Mangalore, and Padur. This represents roughly 9.5 days of net import cover. By contrast, the IEA recommends 90 days. India's official position, confirmed on March 10, 2026, is that it is not mulling a strategic reserve release.
The Russian Oil Pivot — Necessity, Not Choice
India had been progressively reducing its reliance on Russian crude through 2025 under sustained Trump administration pressure. Russian purchases peaked above 2 million barrels per day in mid-2024 but had dropped to an average of 1.06 million barrels per day by February 2026. The Hormuz closure has reversed this trajectory entirely and immediately.
Since the US granted a temporary waiver late last week — covering Russian crude and petroleum products loaded onto vessels before March 5, delivered to India, and purchased by Indian firms — refiners have snapped up all unsold spot cargoes of Russian crude in Asian waters. Total purchases stand at approximately 30 million barrels. Indian Oil Corp acquired around 10 million barrels; Reliance Industries purchased at least as much. The speed of execution reflects the severity of the feedstock emergency.
The price signal tells the full story: Russian grades — Urals, ESPO, Varandey — are now being offered at premiums of $2 to $8 per barrel above Dated Brent. Before the war, Russian oil traded at discounts to the same marker. Russia has shifted from discounted seller to premium emergency supplier in a matter of weeks. Indian refiners are paying that premium because there is no alternative.
Physical confirmation of the pivot is visible in tanker tracking data. Urals-laden tankers Maylo and Sarah — originally signaling Singapore as their destination — changed course within days of the US waiver announcement and are now heading to India. Vessels that had been moving away from the subcontinent are reversing track across Asian waters. The supply pipeline is physically in motion. The bottleneck is not logistics — it is finance.
The critical risk is waiver duration. State Bank of India — India's largest lender with 26% of its international loan portfolio exposed to the US — has refused to process payments for Russian oil even after the waiver, citing reputational risk and uncertainty about how long the concession will last. If SBI cannot facilitate trade finance, smaller Indian banks will face pressure too. The pipeline of Russian supply is logistically available but financially constrained.
Macroeconomic Transmission Channels
→ Current Account Deficit
India's CAD was already running at approximately $15–20 billion per quarter. Every $10/barrel sustained increase in oil prices adds roughly $12–15 billion to India's annual import bill. With WTI up from ~$70 to $88 and capable of re-testing $100+, the CAD deterioration in Q1 FY27 will be substantial.
→ Rupee Pressure
Higher CAD, elevated commodity import costs, and risk-off global sentiment create textbook INR depreciation conditions. The RBI will face the dual challenge of defending the rupee and managing domestic inflation simultaneously. Dollar outflows will accelerate if the crisis extends beyond April.
→ Inflation
Retail petrol and diesel prices in India are administered but linked to global benchmarks through periodic revisions. LPG prices, aviation turbine fuel costs, and freight rates transmit immediately to food, logistics, and manufacturing costs. A sustained $90–100 oil environment puts CPI materially above 5%, complicating RBI's rate trajectory.
→ Fiscal Pressure
The government faces a difficult political choice: pass through oil prices to consumers, or absorb the shock through excise duty cuts that compress fiscal space. Given that fuel taxes are a significant revenue source for both centre and states, any excise relief comes at a direct fiscal cost.
→ Fertilizer and Food Security
India is a major importer of LPG and a significant consumer of urea, whose production is energy-intensive. Disruption to LPG supply and higher natural gas prices feed directly into agricultural input costs. The political sensitivity of food inflation in India cannot be overstated.
India's Strategic Position — Constraints and Levers
India occupies a structurally awkward position. India’s involvement in maritime security would depend on its own policy decisions and operational arrangements. A coordinated reserve release can also affect prices and supply outside participating countries. It lacks the strategic reserves to absorb a prolonged disruption independently. It has been pressured to reduce Russian oil dependence — and has now been forced by circumstance to reverse that reduction in a single week.
India's actual leverage points are limited but real. First, diplomatic: India has maintained communication channels with both Tehran and Washington, positioning itself as a potential back-channel. Second, supply diversification: Indian refiners should accelerate term contracts with West African producers (Nigeria, Angola) and US exporters as Hormuz alternatives. Third, LNG terminal capacity should be maximized to substitute gas-based feedstocks where possible.
The SBI Problem: A Systemic Risk
SBI's refusal to finance Russian oil purchases is not simply a compliance decision — it is a signal of India's deepening integration with US-dollar financial infrastructure. With 26% of SBI's international loan book exposed to the US, the bank is making a rational risk-adjusted calculation: the reputational and regulatory downside of sanctioned-adjacent transactions outweighs the short-term trade finance upside.
This creates a structural hole. The US waiver permits the trade. The finance system will not facilitate it at scale. Until India develops robust rupee-rouble settlement infrastructure or designates second-tier banks specifically for sanctioned-corridor trade — with explicit government backing and liability protection — the gap between supply availability and actual delivery will persist.
Key Risks for India: Summary
RISK | PROBABILITY | IMPACT | INDIA'S BUFFER |
|---|---|---|---|
Prolonged Hormuz closure (>4 weeks) | Medium-High | Critical — refinery feedstock shortfalls begin | 9.5 days SPR. Negligible. |
US waiver on Russian oil revoked | Medium | Severe — 30 mb already purchased; future volumes locked out | None. Diplomatic dependency. |
Oil above $100 sustained | High if war continues | CAD deterioration, INR weakness, CPI spike | RBI FX reserves ~$620 bn. Partial cushion. |
LPG / fertilizer supply shock | Medium-High | Food inflation, rural distress, political pressure | Domestic buffer stocks limited |
SBI trade finance paralysis | Current — already materializing | Russian oil pipeline severed despite waiver | None identified |
CONCLUSION
The Strait of Hormuz crisis is not solvable by financial engineering. SPR releases, tax waivers, and blending rule changes address a stock problem. The crisis is a flow problem: 16–17 million barrels per day cannot physically move. No reserve release can replicate physical cargo delivery through a closed strait.
The resolution is purely kinetic and diplomatic: either US/allied forces degrade Iran's mine-laying and anti-ship capabilities sufficiently to escort tankers through, or a ceasefire is negotiated. Trump's public statements suggesting the war could be "over soon" are being contradicted by Pentagon escalation signals. Markets will remain in headline-driven volatility until this contradiction resolves.
For India, the stakes are higher than for most non-Gulf nations. Structural import dependence, thin strategic reserves, and financial system exposure to US sanctions infrastructure combine to create a vulnerability that cannot be managed passively. New Delhi must use every diplomatic channel, accelerate non-Gulf supply contracting, and resolve the trade finance gap on Russian oil immediately — not after the crisis has run its course.


