

Original Lens and publication context
Oil, equities, and credit priced full normalization after the US–Iran deal. Rates, gold, refining margins, and the crude curve never did. The Hormuz re-escalation now forces one side of the market to admit it was wrong.
- Deutsche Bank's dislocation map — published hours before the new strikes — shows oil, equities, and credit fully normalized since the MoU while rates price lasting damage: the US 10-year real yield is up more than 50bps and the 2-year real yield more than 150bps since late February.
- Markets are simultaneously pricing collapsing inflation (the 1-year swap at 2.11%, near two-year lows) and 30bps of Fed hikes by December — with financial conditions at their loosest of the decade, unlike any prior hiking launch point.
- Gold is down 22% since late February through a gold-friendly year while the 2026 CPI consensus has risen toward 3.5% — real yields, not inflation, are setting the price, and equities have yet to pay the same toll.
- The physical economy contradicts the spot barrel: strait transits remain a fraction of pre-war levels, container freight has doubled, and refining cracks sit near highs against a soft crude price.
- Microstructure adds convexity: record dealer inventory is repressing measured volatility and implied correlation is near record lows — index calm is being manufactured, not earned. Position for convexity over direction; underweight the duration-sensitive risk leg.
SETUP — The Session That Cracked the Trade
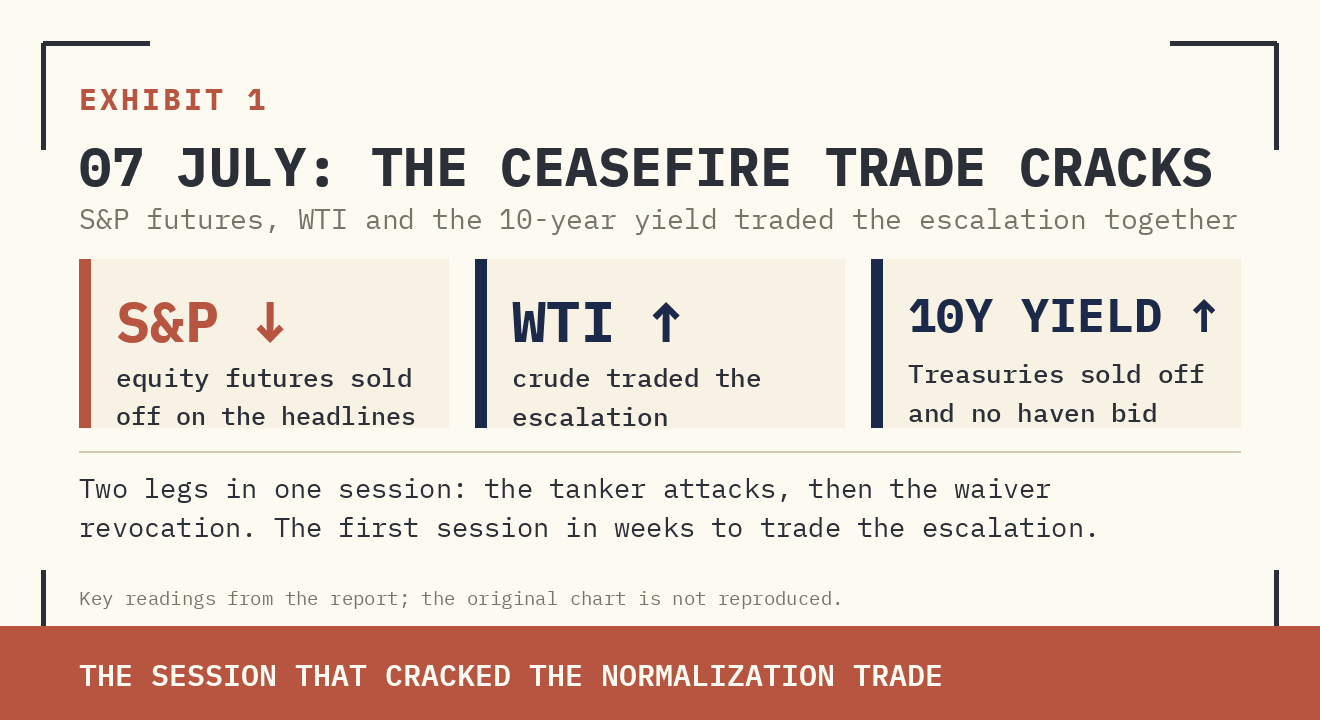
On 07 July, for the first time in weeks, the cross-asset tape traded the escalation rather than the normalization: equity futures, crude, and Treasury yields moved together on the tanker headlines, and the curve sold off across every tenor in two distinct legs — the attacks, then the waiver revocation. That session is the hinge between the dislocation map below and the position at the end of this report.
Supplied archive exhibit · original labels. Read alongside the editorial corrections.
07 July intraday: the ceasefire trade cracks across assets. S&P futures, WTI (inverted) and the 10-year yield (inverted) sold off together on the tanker headlines — the first session in weeks where all three simultaneously traded the escalation rather than the normalization.
Supplied archive exhibit · original labels. Read alongside the editorial corrections.
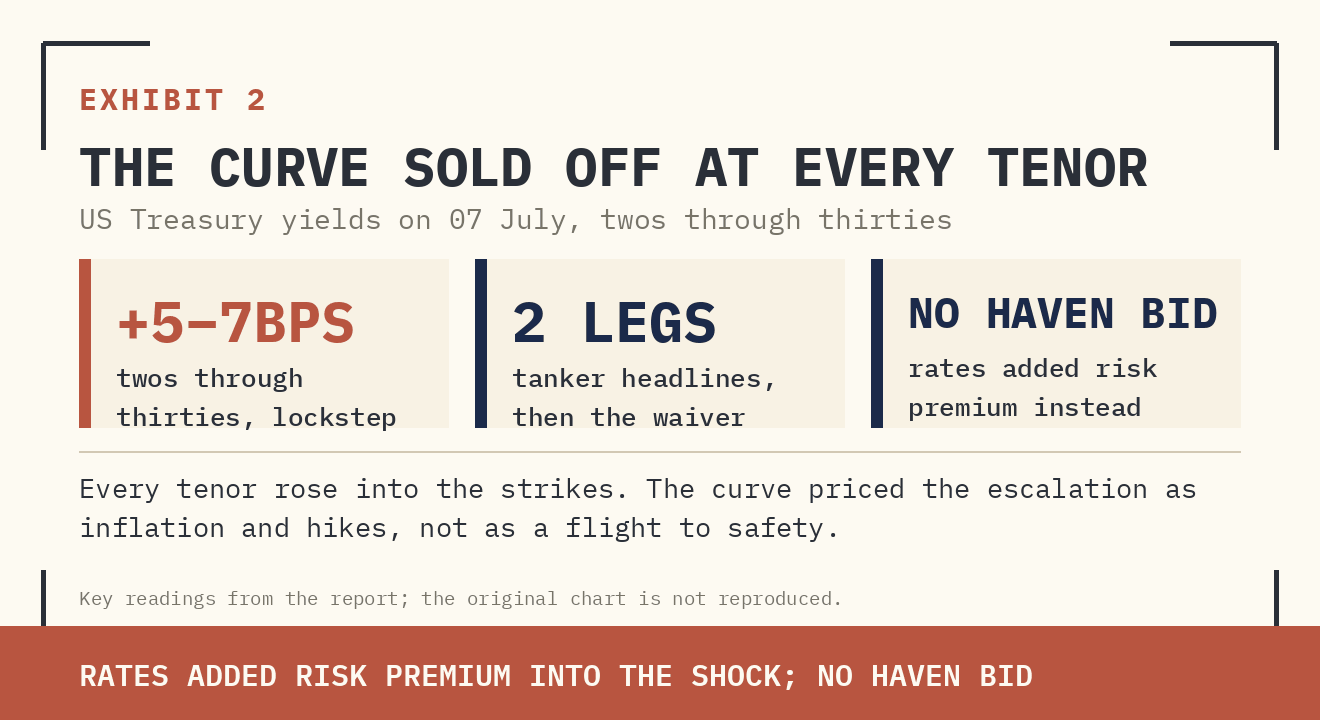
The Treasury curve sold off across every tenor into the strikes. Twos through thirties rose 5–7bps in lockstep on 07 July, in two distinct legs — the tanker headlines, then the waiver revocation. Rates added risk premium into the shock instead of catching a haven bid.
THE SIX DISLOCATIONS
Deutsche Bank's macro strategy team published, hours before the strikes, a survey of the six largest cross-asset inconsistencies in current pricing. Read against last night's escalation, the note stops being a curiosity list and becomes a target map: each dislocation is a bet on normalization that the Hormuz re-escalation directly attacks.
1. Oil fell; Treasury yields did not follow
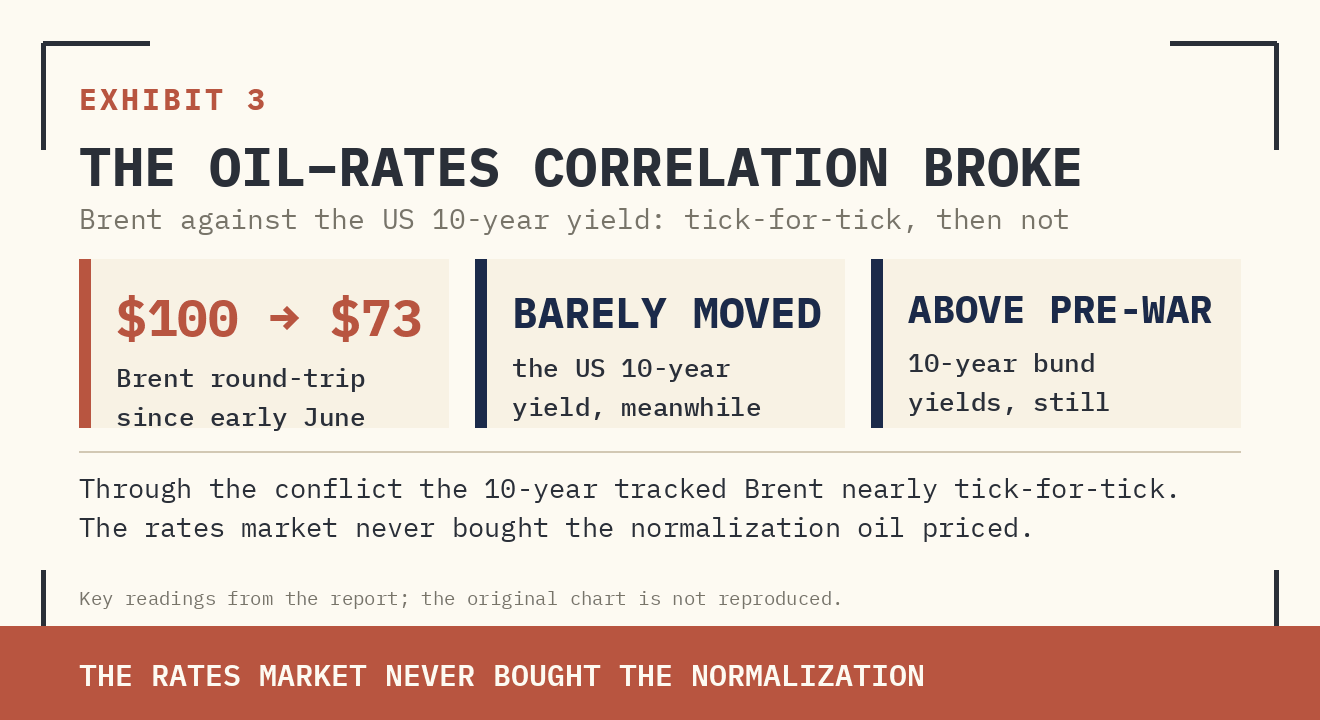
Through the conflict, oil and the US 10-year traded nearly one-for-one — higher crude meant higher inflation meant more hikes priced. Brent has since round-tripped from roughly $100 to $73, yet the 10-year yield has barely moved, and 10-year bund yields remain well above pre-conflict levels. The rates market never bought the normalization that the oil market priced.
Supplied archive exhibit · original labels. Read alongside the editorial corrections.
The oil–rates correlation broke a month ago. Through the conflict, the 10-year Treasury tracked Brent nearly tick-for-tick. Since early June, Brent collapsed from roughly $100 to $73 and yields refused to follow — the rates market never bought the normalization.
2. Inflation swaps collapsed while Fed-hike pricing rose
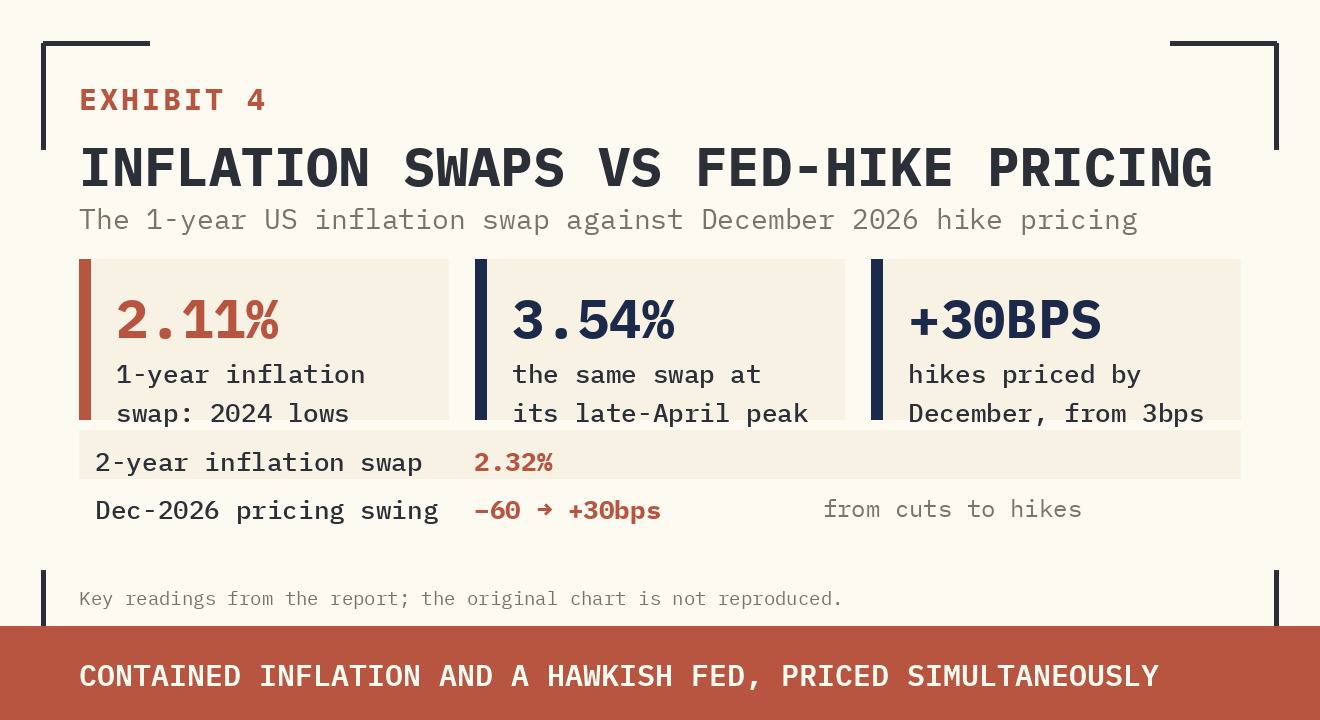
The 1-year US inflation swap sits at 2.11%, near its lowest since late 2024 and far below the 3.54% peak of late April; the 2-year is at 2.32%. Yet futures now price roughly 30bps of hikes by December, up from just 3bps when inflation expectations peaked. Markets are pricing contained inflation and a more hawkish Fed at the same time — a configuration the labor market's one-tenth improvement in unemployment cannot carry alone.
Supplied archive exhibit · original labels. Read alongside the editorial corrections.
Inflation swaps at 2.11% — with 30bps of hikes priced. The 1-year inflation swap has round-tripped to its lowest since 2024 while December 2026 hike pricing swung from −60bps to +30bps. Contained inflation and a hawkish Fed are priced simultaneously — a configuration that needs an explanation of policy credibility, growth and timing.
3. Hikes are priced, but financial conditions are among the loosest in a decade
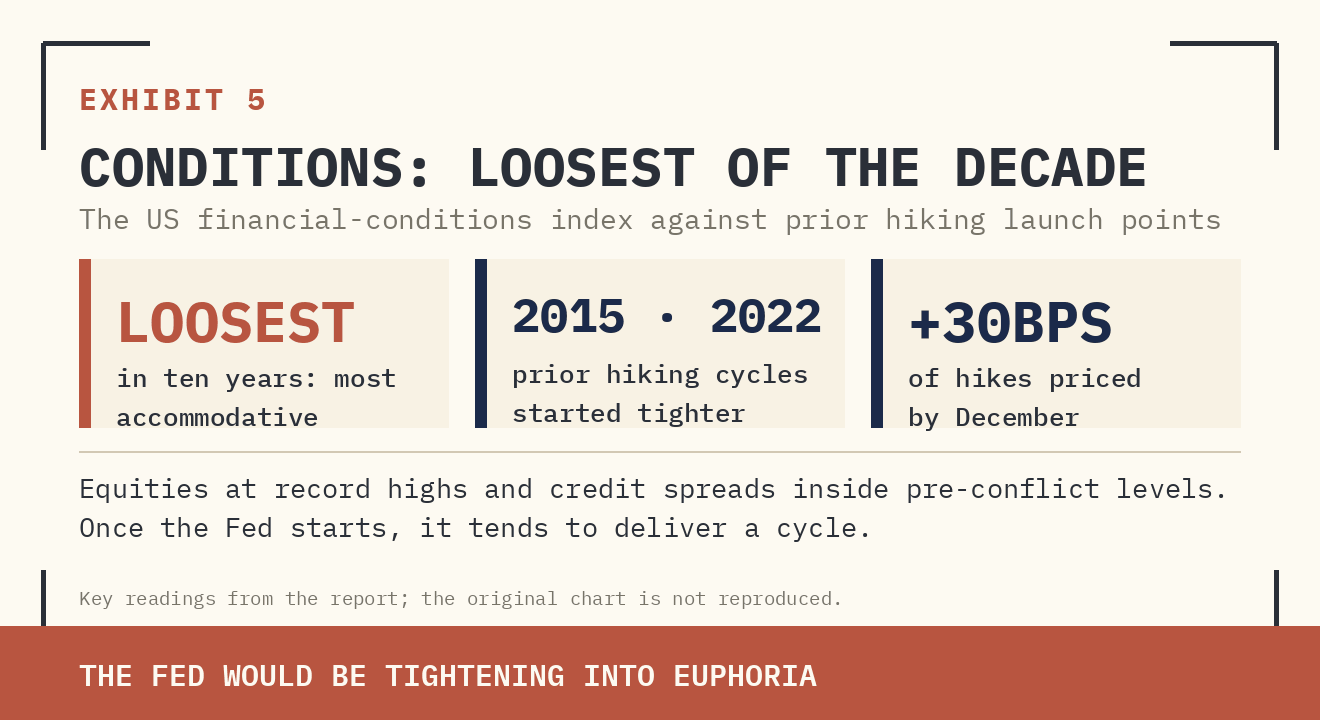
Equities sit at record highs, credit spreads are inside pre-conflict levels on both sides of the Atlantic, and aggregate financial conditions are near their most accommodative of the decade. Every recent Fed hiking episode began from tighter conditions than these — and the historical record is overwhelmingly against a one-and-done: once the Fed starts, it tends to deliver a cycle.
Supplied archive exhibit · original labels. Read alongside the editorial corrections.
Financial conditions are the loosest of the decade — into priced hikes. The US financial-conditions index sits at its most accommodative in ten years. Both prior hiking cycles — 2015 and 2022 — launched from materially tighter setups. The Fed would be tightening into euphoria.
Figure 01 · Qualitative comparison
What each market may be pricing
| Market | Question it helps answer | Necessary caution |
|---|---|---|
| Policy rates | How restrictive might policy become? | Expected policy is not realised policy |
| Real yields | What return compensates for postponing consumption? | Growth and supply matter too |
| Equities and credit | What earnings and default path is expected? | Composition and risk premia differ |
| Oil and freight | How tight are physical supply chains? | Different delivery horizons can diverge |
| Gold and volatility | What insurance is being priced? | Neither is a universal crisis hedge |
4. Rates price lasting damage; every other risk asset prices full recovery
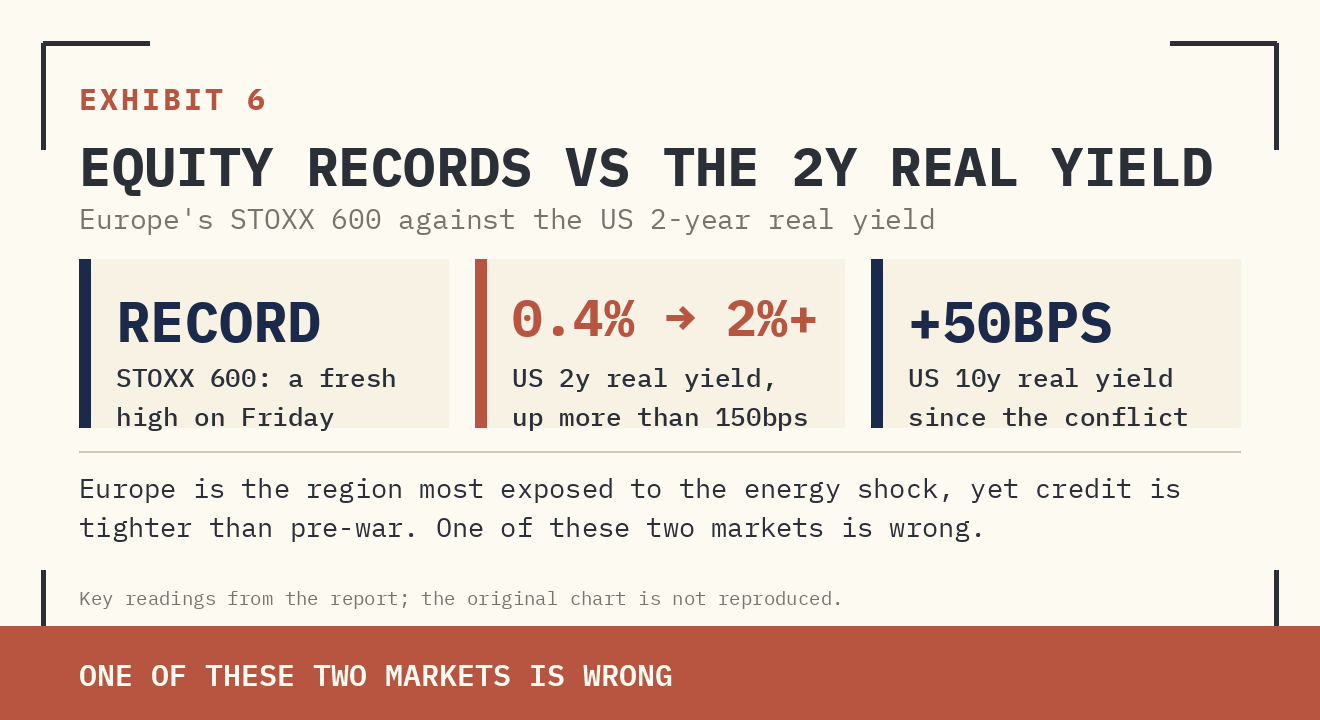
The US 10-year real yield is up more than 50bps since the conflict began; the 2-year real yield is up more than 150bps. Meanwhile global equities are at records — Europe's STOXX 600 printed a fresh high on Friday despite Europe's direct energy exposure — and credit is tighter than pre-war. One of these markets is wrong.
Supplied archive exhibit · original labels. Read alongside the editorial corrections.
Equities at records while the 2-year real yield reprices 150bps. Europe's STOXX 600 — the region most exposed to the energy shock — recovered to new highs, while the US 2-year real yield surged from roughly 0.4% to above 2%. One of these two markets is wrong.
5. Gold has sold off through a gold-friendly year
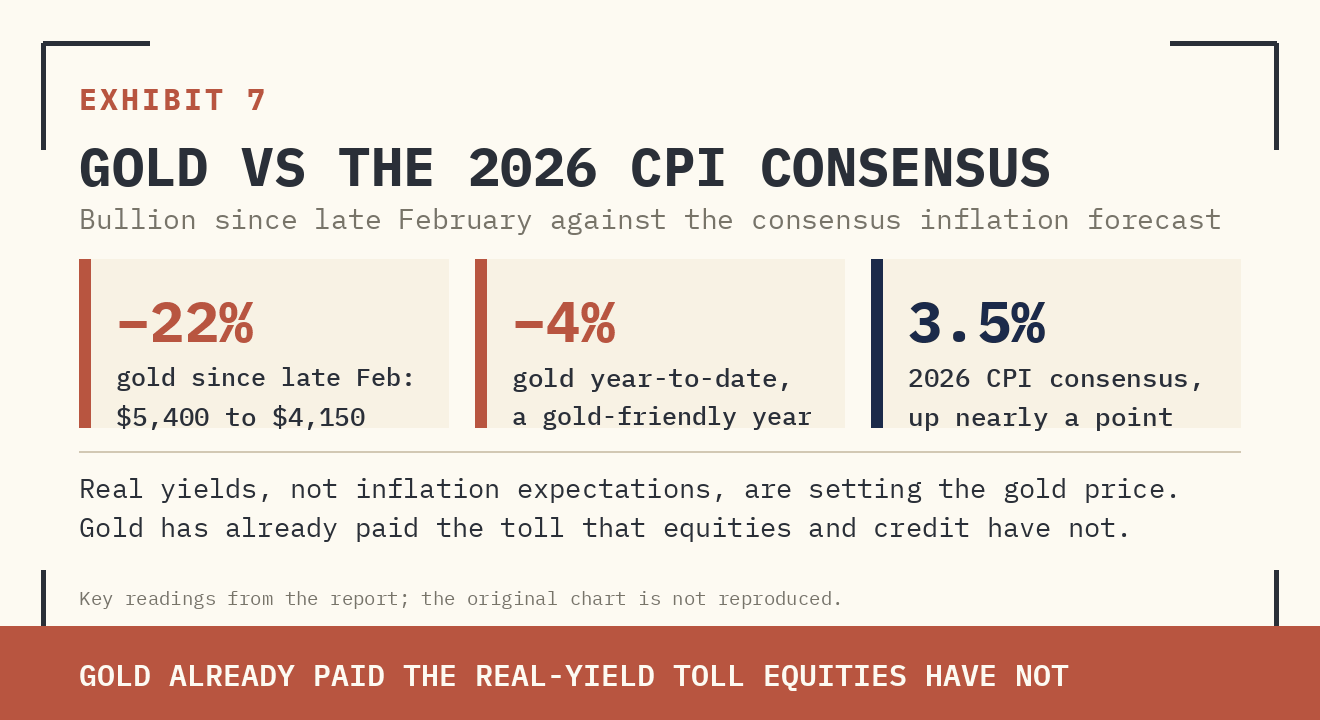
Gold is down 4% year-to-date and 22% since late February — through mounting geopolitical crises, an upside inflation shock, and undiminished fiscal deficits. Higher real yields explain the move, but then the puzzle inverts: the same real-yield repricing that broke gold has left equities and credit untouched. Gold is the one risk-adjacent asset already trading the rates market's story.
Supplied archive exhibit · original labels. Read alongside the editorial corrections.
Gold down on the year — while 2026 CPI consensus rises toward 3.5%. Bullion has fallen from about $5,400 to $4,150 despite an inflation consensus that has risen nearly a point. Real yields, not inflation expectations, are setting the gold price — it already paid the toll equities have not.
6. Spot oil normalized; the physical strait did not
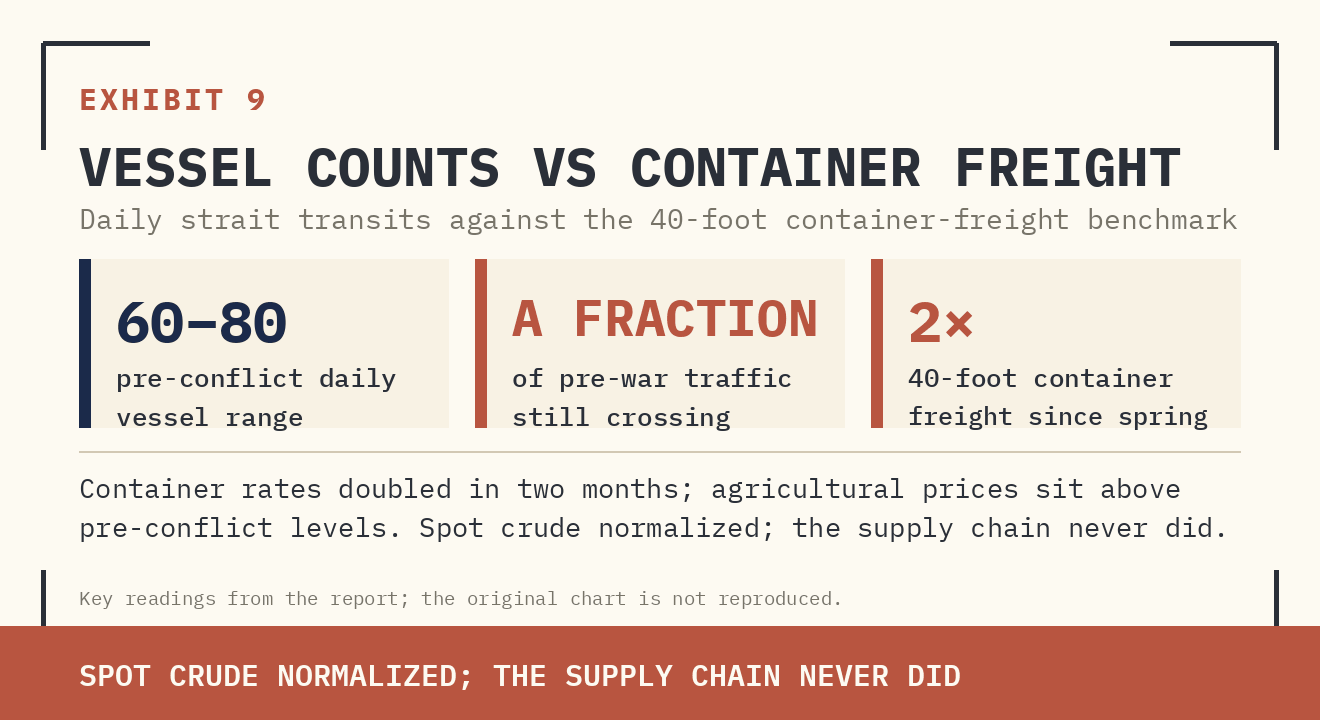
Brent trades below its pre-conflict level while the strait carries a fraction of pre-war traffic, container rates have doubled in two months, agricultural prices sit above pre-conflict levels, and the 12-month Brent future holds roughly a $5 premium to its pre-war level. The curve, unlike spot, never believed the disruption was over. Last night it was proven right.
Supplied archive exhibit · original labels. Read alongside the editorial corrections.
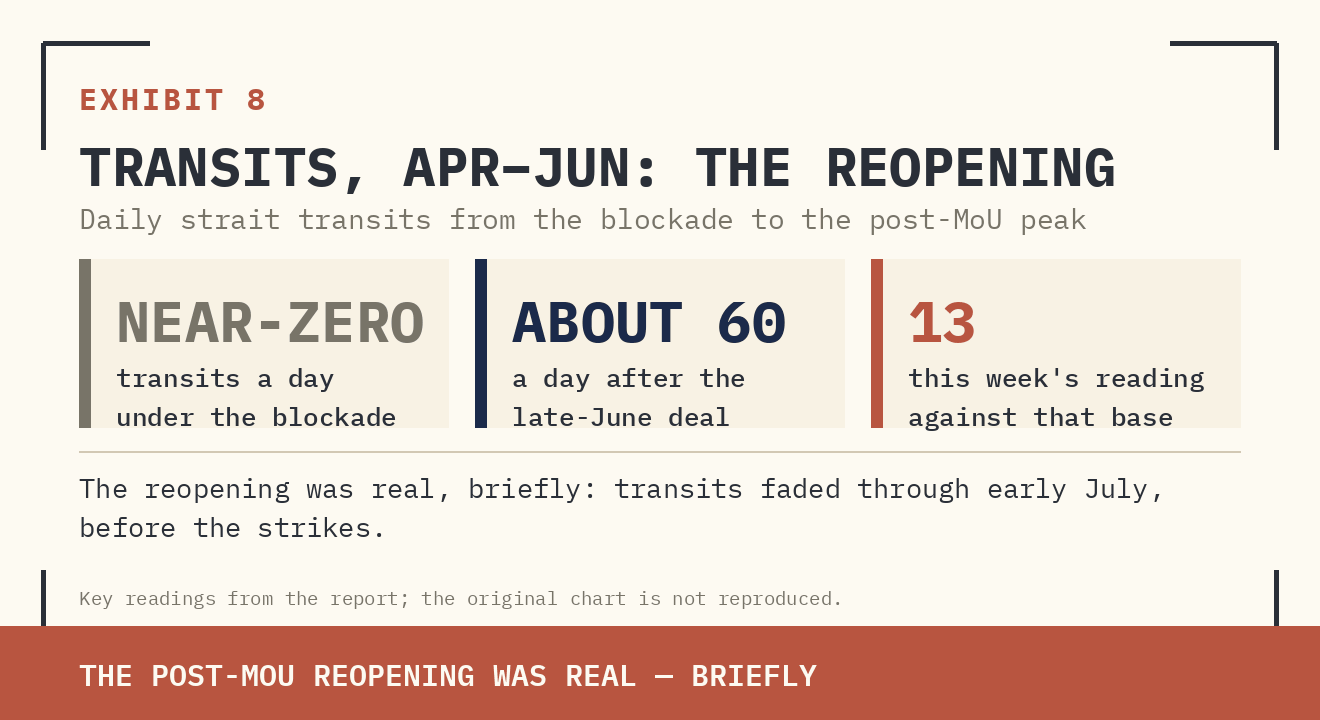
The post-MoU reopening was real — briefly. Transits surged from near-zero under the blockade to about 60 a day after the late-June deal, then faded through early July. This is the baseline against which this week's reading of 13 must be judged.
Supplied archive exhibit · original labels. Read alongside the editorial corrections.
The strait carries a fraction of pre-war traffic; container freight has doubled. Vessel counts remain far below the pre-conflict 60–80 daily range, and the 40-foot container-freight benchmark has doubled since spring. Spot crude normalized; the supply chain never did.
Supplied archive exhibit · original labels. Read alongside the editorial corrections.
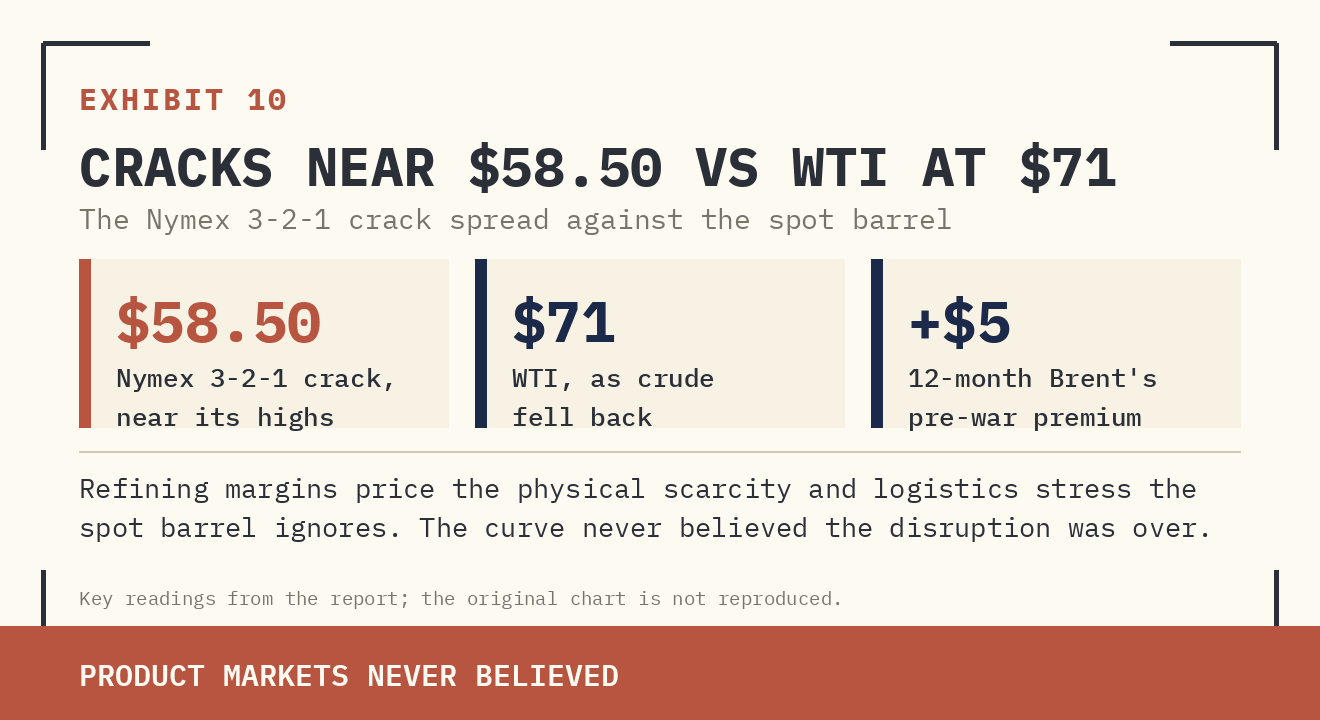
Cracks near $58.50 while WTI sits at $71 — product markets never believed. The Nymex 3-2-1 crack spread surged toward its highs even as crude fell back — refining margins pricing the physical scarcity and logistics stress that the spot barrel has been ignoring.
Only a growth surge reconciles all six. Absent that, either rates rally back to the oil-and-swaps story, or risk assets reprice to the story rates and gold are already telling. Hormuz just voted for the second path.
RISK — Microstructure Is the Accelerant
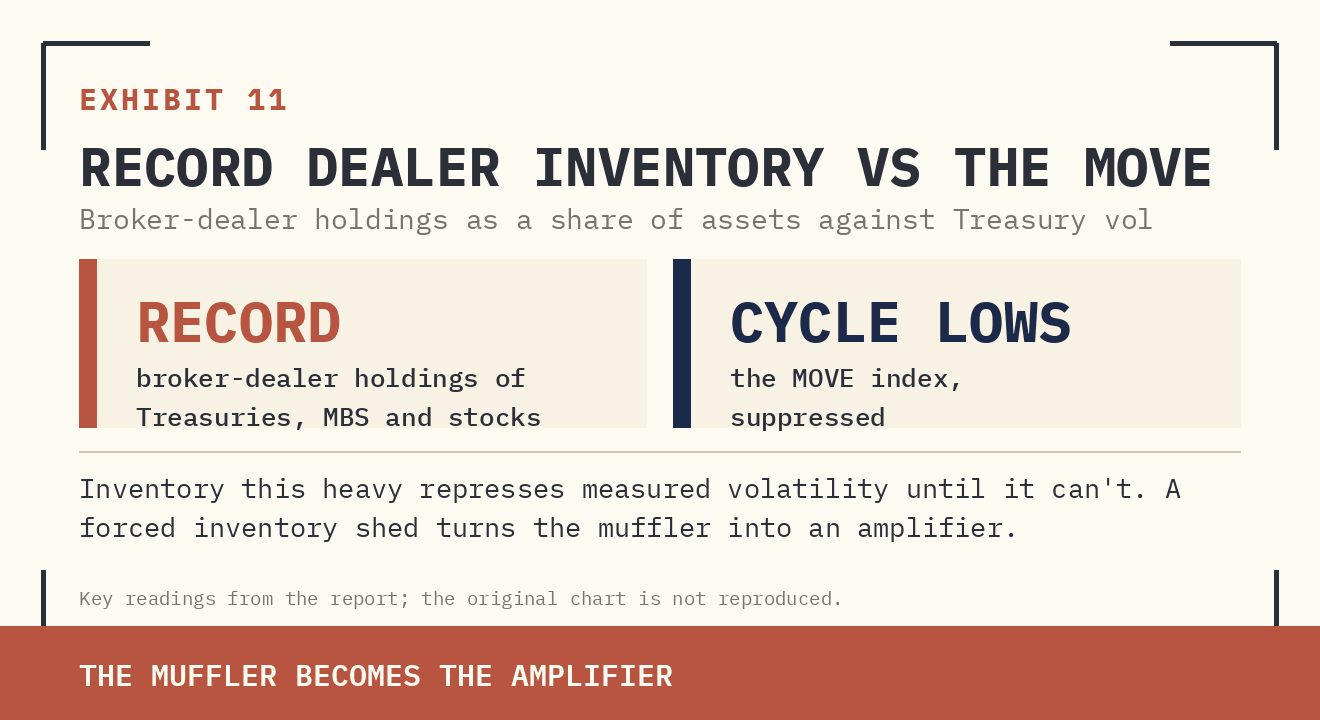
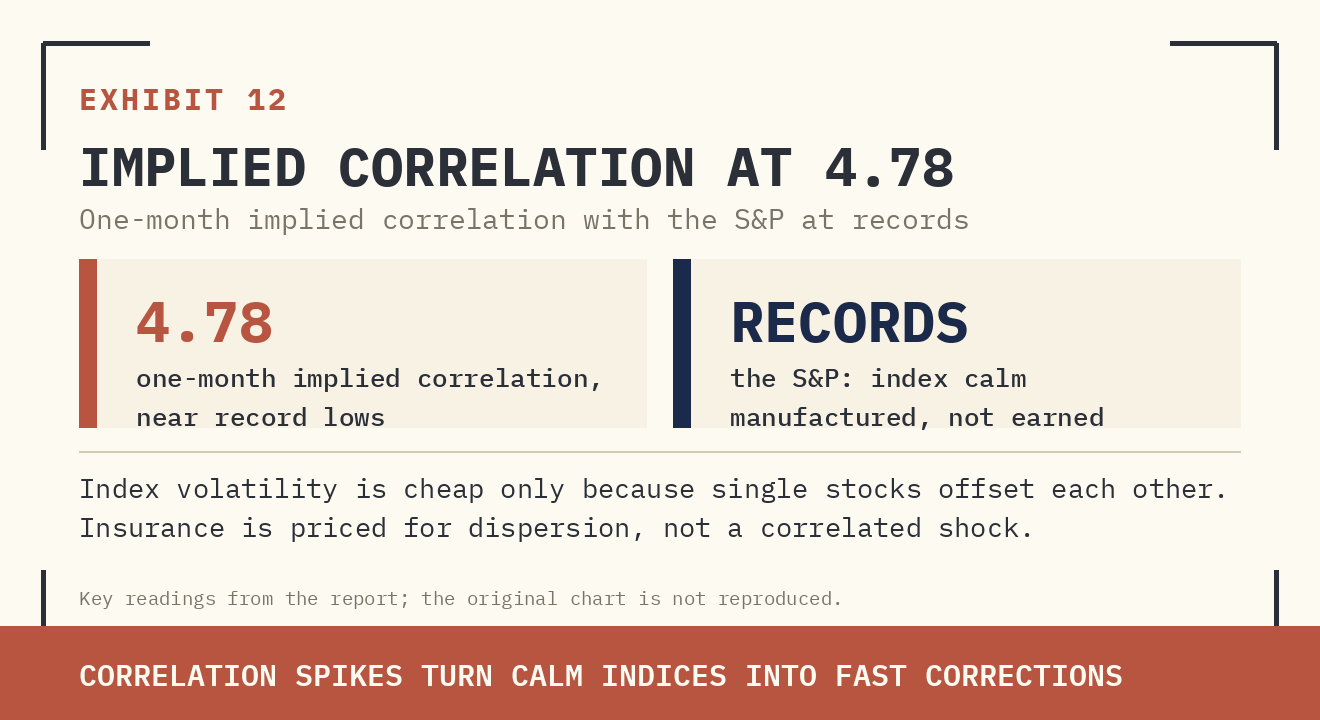
The market's own microstructure adds convexity in both directions. Record dealer inventory has been repressing measured volatility; a forced inventory shed turns the muffler into an amplifier. And index-level implied correlation near record lows means portfolio insurance is priced for dispersion, not for the correlated shock that a strait closure or a hit on a US warship would deliver.
Supplied archive exhibit · original labels. Read alongside the editorial corrections.
Record dealer inventory is sitting on volatility. Broker-dealer holdings of Treasuries, MBS and stocks are at a record share of assets while the MOVE index is suppressed near cycle lows. Inventory this heavy represses vol until it can't — then it amplifies the move it was muffling.
Supplied archive exhibit · original labels. Read alongside the editorial corrections.
Implied correlation at 4.78 — the fragility signal. One-month implied correlation near record lows with the S&P at records means index volatility is cheap only because single stocks offset each other. Correlation spikes are the mechanism by which calm indices become fast corrections.
The de-escalation risk to the position is equally concrete. The structure of the deal — Iran wants money, the US wants free energy flow — means both sides retain an incentive to rebuild it; a former NSC Iran director's read is that the MoU is too unstable to survive without a follow-on agreement precisely because neither side is getting what it wants. Qatar has already brokered resumption of talks once. If a follow-on deal restores the waiver and safe passage within weeks, the war premium bleeds out of the crude curve and the energy overweight underperforms. The second thesis-breaker is the benign resolution: if global growth genuinely surprises to the upside — and data has been beating — then high real yields, record equities, and hawkish Fed pricing all cohere, no asset class needs to correct, and the short-risk leg of the position pays nothing. The dot-com precedent cuts both ways: the 2000 valuation adjustment came a full year before the 2001 recession, which means the repricing does not require a downturn — but also that timing it is unforgiving.
PRICE — The Asymmetry Favors the Cautious Market
On the rates-versus-risk axis, the asymmetry favors the cautious market. If the re-escalation persists, inflation swaps reprice higher from two-year lows, the hawkish Fed pricing gains a second justification beyond the labor market, and record-high equities meet rising real yields plus an energy shock with financial conditions starting from decade-loose levels — maximum distance to travel. If instead the deal is rebuilt, rates converge down toward the swaps story, which is a duration rally, not an equity crash. Equities and credit are priced for the single path — swift normalization plus strong growth — while rates, gold, and the crude curve are priced for the distribution. Overnight, the distribution won.
POSITION — Sector-Level Expression
Underweight duration-sensitive, valuation-extended risk assets at the index level. This is the mispriced leg: record-high equities and inside-pre-war credit spreads are incompatible with 150bps of 2-year real-yield repricing plus a live energy shock, unless the growth surge arrives on schedule. Reduce beta, favor quality and cash-flow duration over long-duration growth exposure — and treat the momentum factor as the highest-beta expression of the crowding.
Own volatility where it remains cheap relative to the event path. A binary week — strike campaign in progress, retaliation claims unconfirmed, a NATO summit in Ankara with Iran at the top of the agenda — against risk-asset pricing built for calm, suppressed by record dealer inventory and record-low implied correlation, is the textbook setup for convexity over direction.
Avoid the gold reflex. Gold has already paid the real-yield toll that equities have not; it is the wrong instrument for this specific dislocation until real yields peak. The geopolitical hedge here is energy and volatility, not bullion.
Overweight the global energy sector. Energy was already the best-performing sector on the first tanker headlines, before the strike package and waiver revocation. The sector monetizes both the spot repricing and the more durable curve premium, and it is the natural hedge against the sixth dislocation resolving upward.


