
Original Lens and publication context
The second half of the AI trade belongs to the cost of capital. The build must be funded before the benefits arrive — and the market has begun pricing the difference.
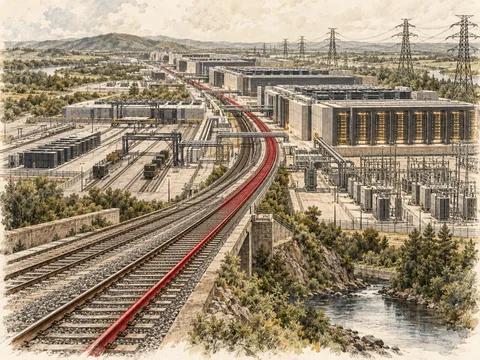
- AI is still framed as a software cycle, but the physical build underway is an infrastructure boom closer to the railway era — and infrastructure booms raise the cost of capital while software cycles lower it.
- Hyperscale capex funding is leaking off private balance sheets into expanding credit issuance and, now, the equity channel — a private-sector supply leg competing with fiscal borrowing for the same waning duration bid.
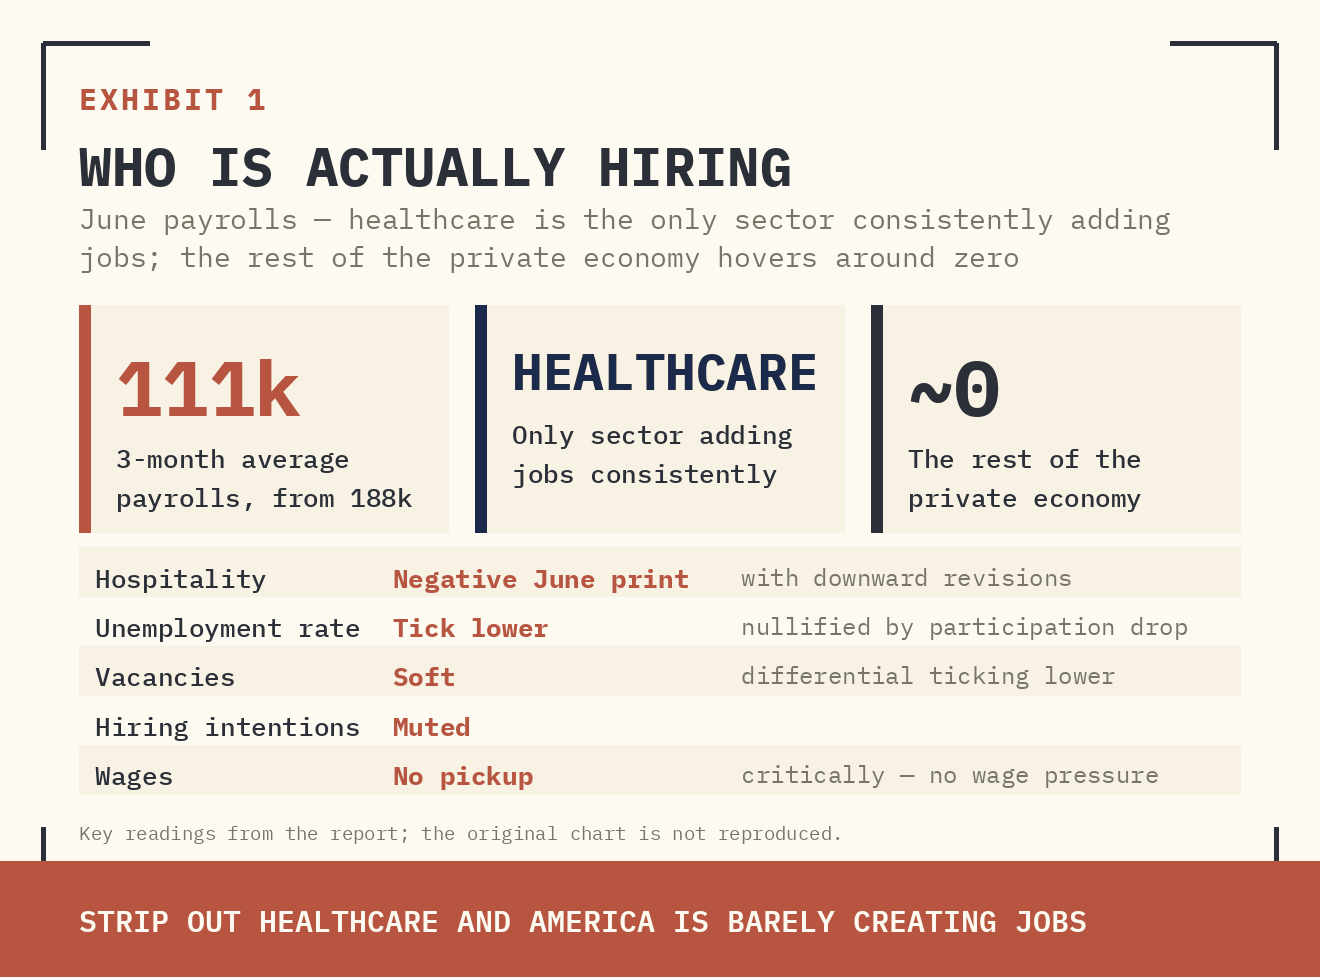
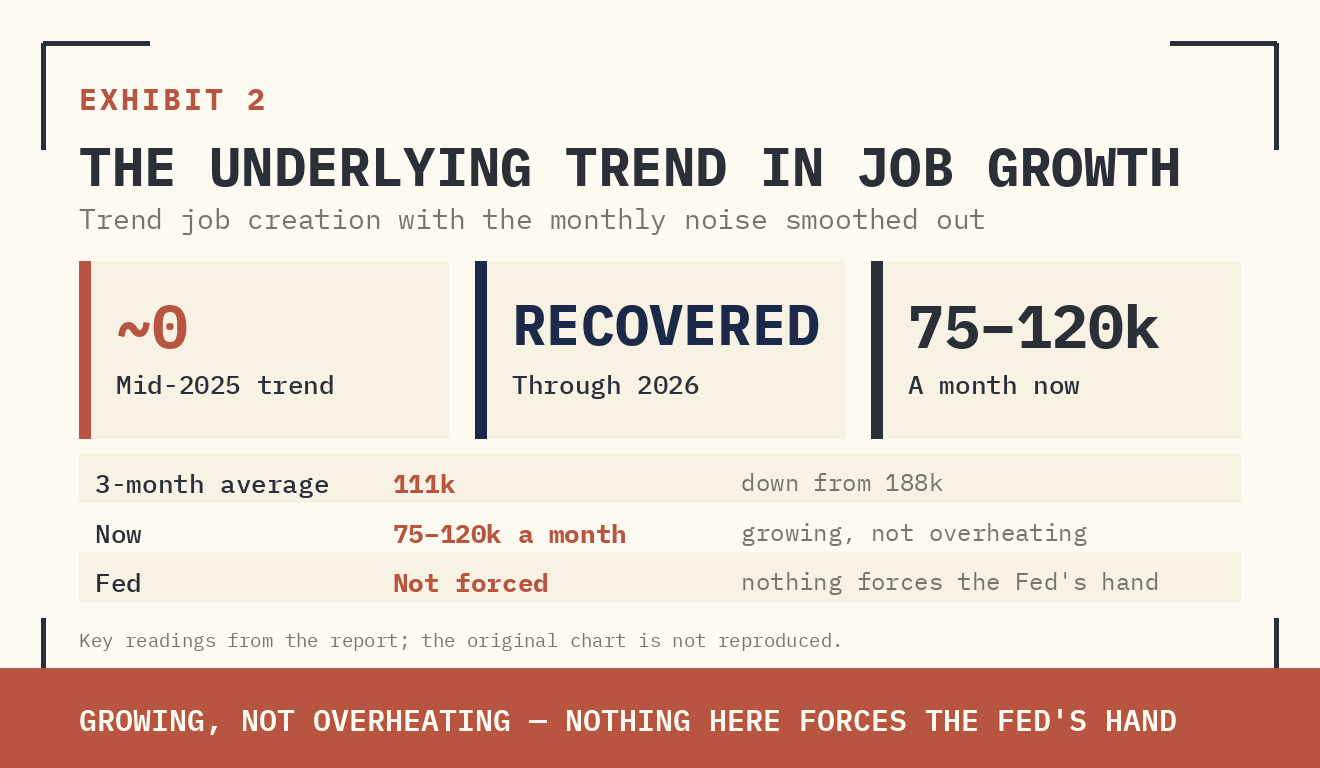
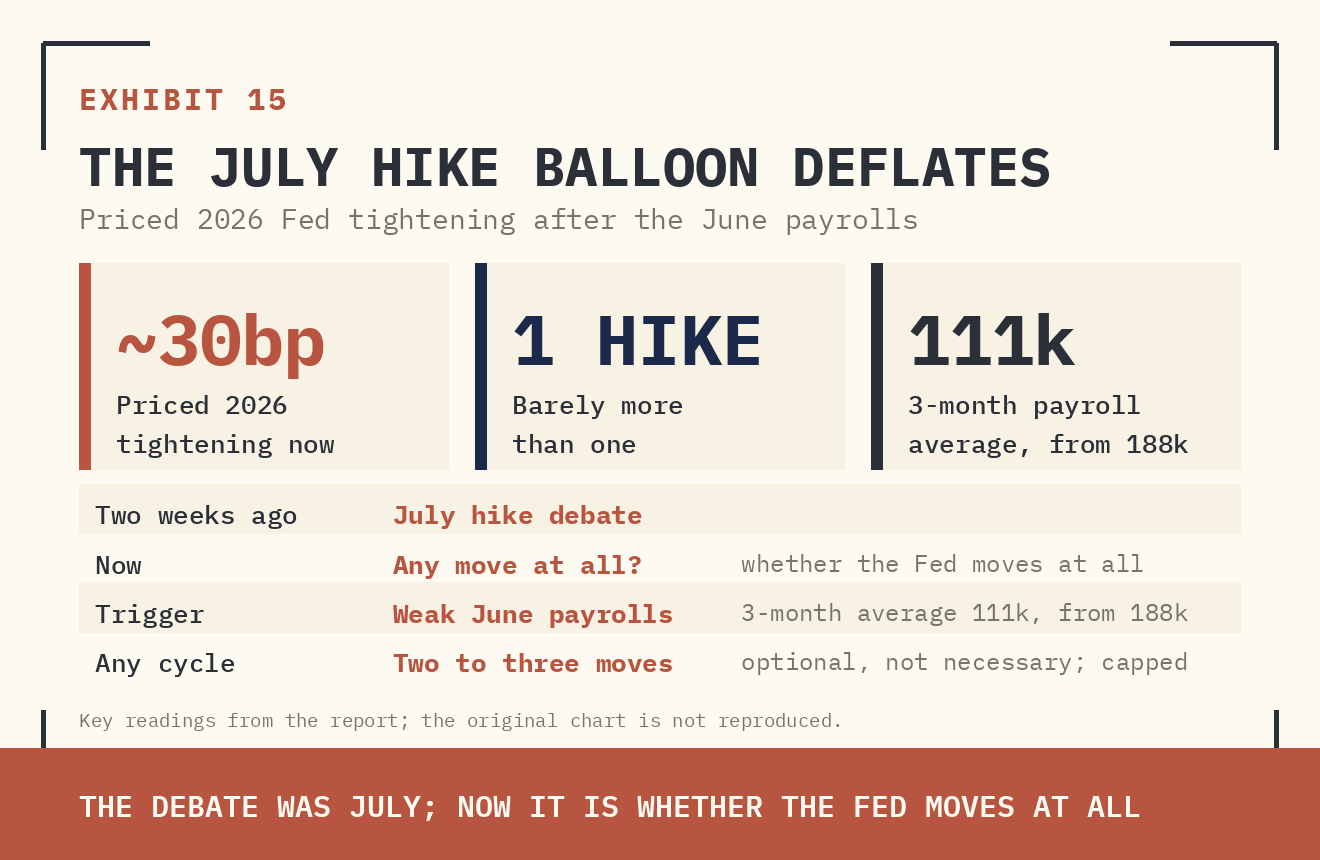
- Soft June payrolls (three-month average down to 111k from 188k) and a mildly dovish Sintra performance from the Fed chair compress July hike risk; any tightening is optional, shallow, and capped at two to three moves.
- Equity leadership is rotating out of the AI capex suppliers — semiconductors and memory — and into the hyperscale spenders and rate-sensitive broadening trades, the fourth such rotation of this AI cycle.
- The macro desk caps long-end rallies while the equity desk expects front-end hike pricing to unwind — both are right at their own tenor, and the reconciliation is a steeper curve.
I. Trigger
Three developments converged in the first week of July, and together they flipped the framing of the AI trade from where the year began. Micro is once again driving macro — but the question has shifted from how large the productivity dividend will be to how the build that precedes it gets funded.
The first trigger was the labour market. June payrolls took the air out of the July hike balloon. The three-month average of nonfarm payrolls has slipped to 111k from 188k, the acceleration story has faded, and the tick lower in the unemployment rate was nullified by a simultaneous drop in participation. Downward revisions and a negative June print for hospitality leave health services as the only genuine job creator. The softness is corroborated across the panel: vacancies are soft, the labour-market differential is ticking lower, hiring intentions are muted, and — critically — there is no pickup in wages.
Supplied archive exhibit · original labels. Read alongside the editorial corrections.
Supplied archive exhibit · original labels. Read alongside the editorial corrections.
The second trigger was Sintra. Chair Warsh gave away little — a Greenspan-era communication style is clearly the objective — but the balance of his remarks tilted dovish. Inflation risks were characterised as having come down, and his emphasis on the employment side of the dual mandate was more pronounced than at the June FOMC. His AI commentary, notably, focused on the destination: the supply-side impact that could eventually lower neutral rates. It is precisely that framing this report challenges.
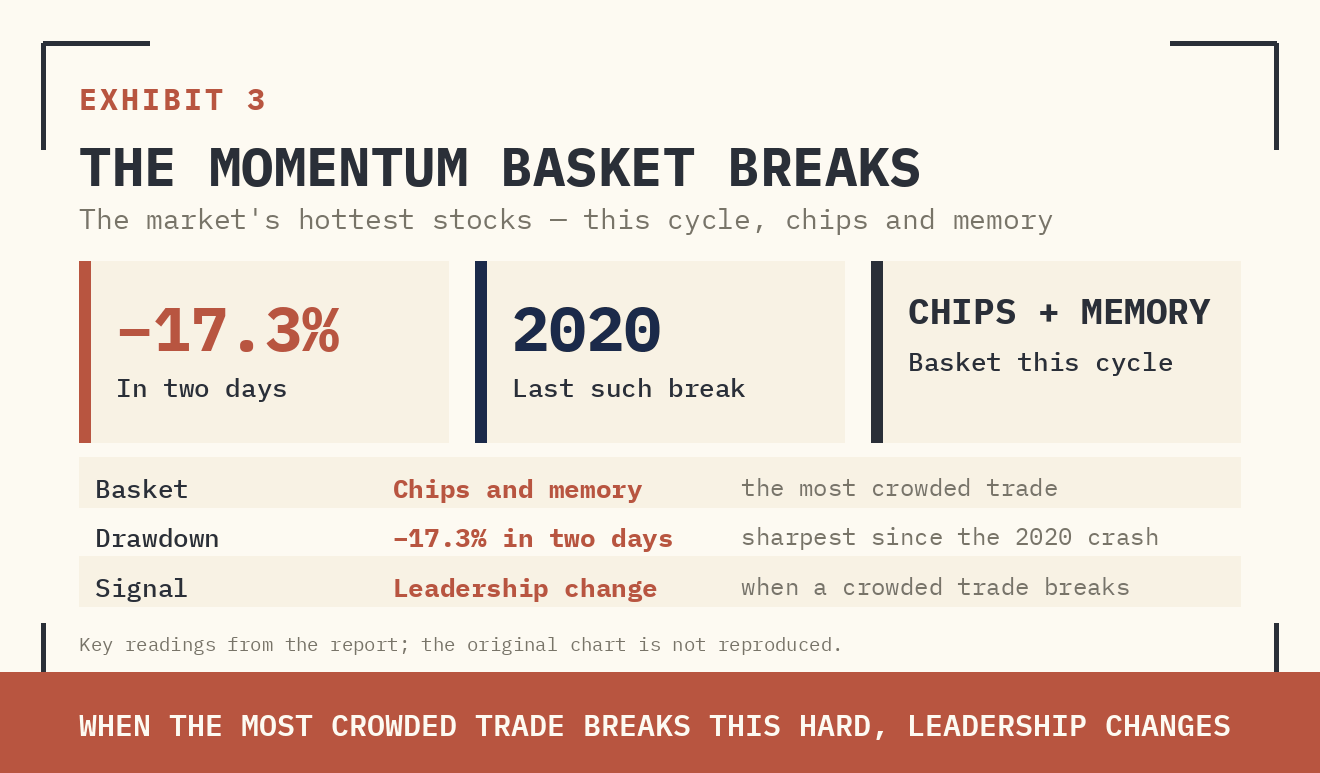
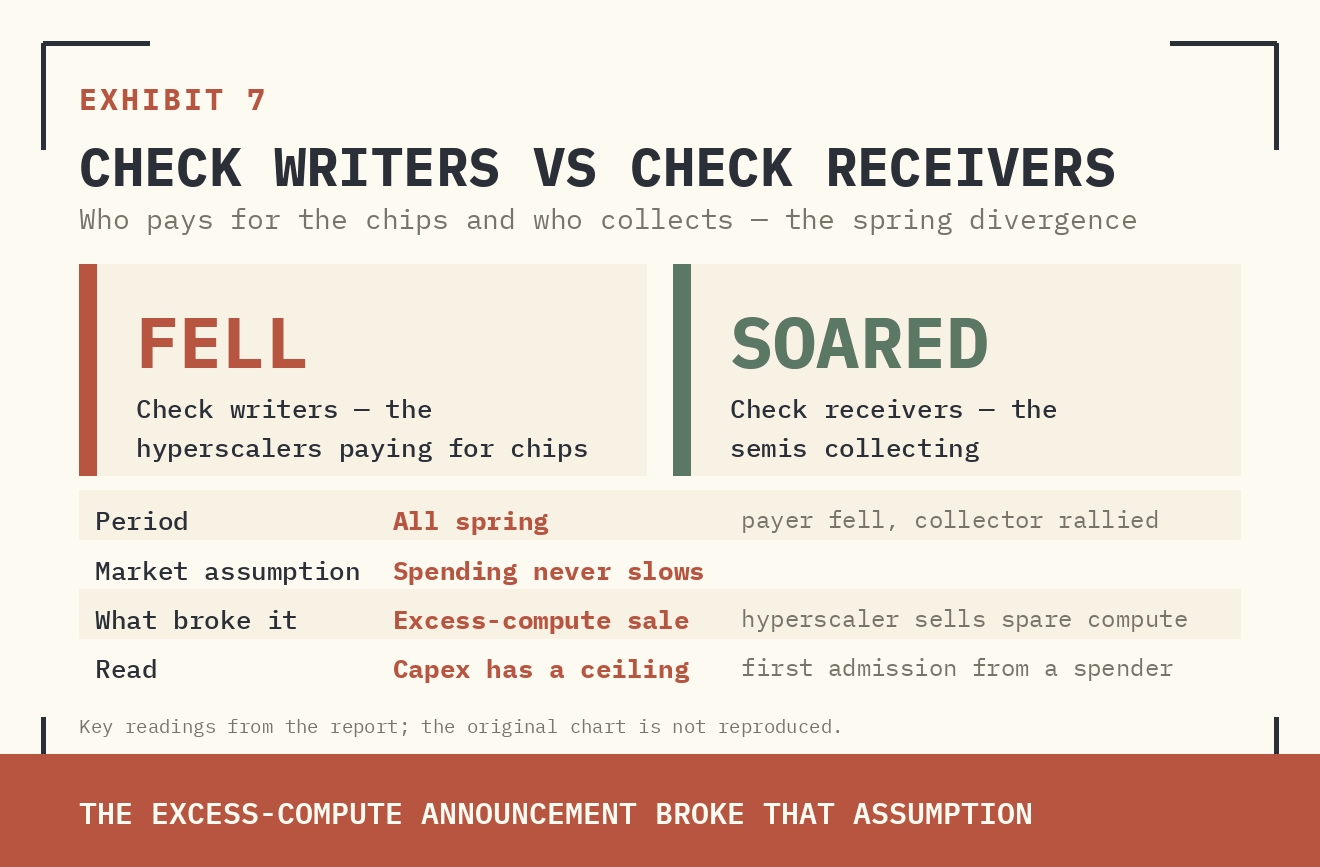
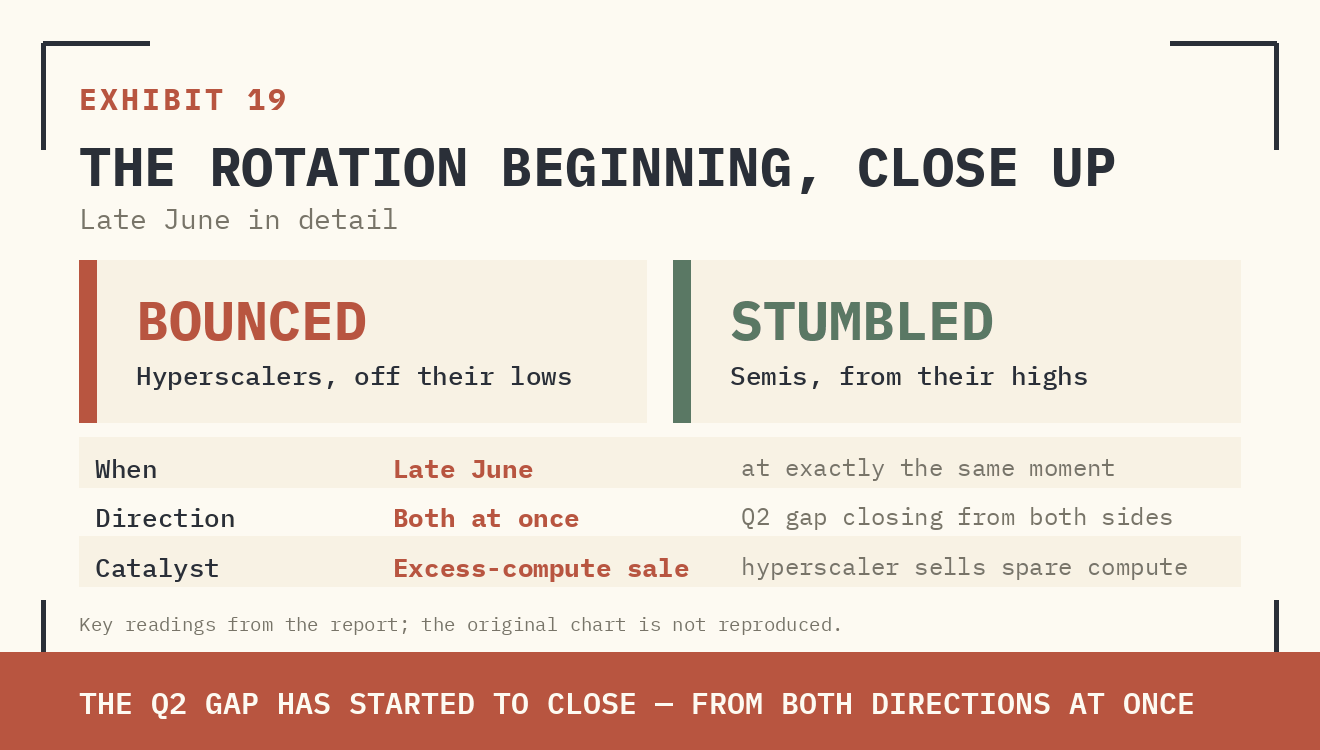
The third trigger came from the market's own internals. The high-beta momentum basket — read: memory and chip names — suffered its largest two-day drawdown since the pandemic, ending a historic run in semiconductors that had persisted since the end of March. The catalyst structure matters more than the drawdown itself: one of the largest hyperscale platforms announced it would begin selling excess compute capacity to outside customers, the first public admission from inside the spending complex that capex trajectories can bend.
Supplied archive exhibit · original labels. Read alongside the editorial corrections.
The first hyperscaler to sell its spare compute told the market what discounted cash flow models could not: the capex assumptions have a ceiling.
II. Flow
The dominant framing of AI as a productivity story has supported the rates outlook at points this year: disinflation eventually, cheaper compute, better margins, possibly fewer jobs, a lower neutral rate down the road. That framing is likely right about the destination. It places far too little weight on the journey.
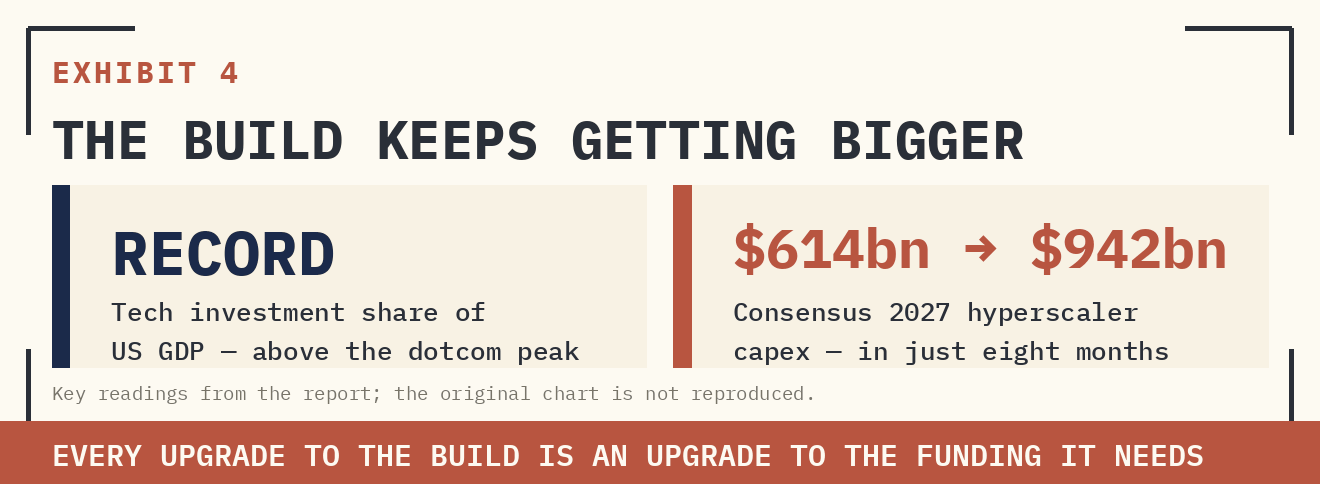
What is underway is not a software cycle. It is a capex cycle — one closer in physical footprint to a railway build than to the dotcom expansion that keeps getting drawn as the comparison. The distinction is not rhetorical; it is the entire rates story. The software cycle lowered equilibrium rates because it needed very little capital to scale. Infrastructure booms raise them, because they compete for scarce capital — steel, land, power, grid connections, skilled construction labour, cooling, and above all, funding.
Supplied archive exhibit · original labels. Read alongside the editorial corrections.
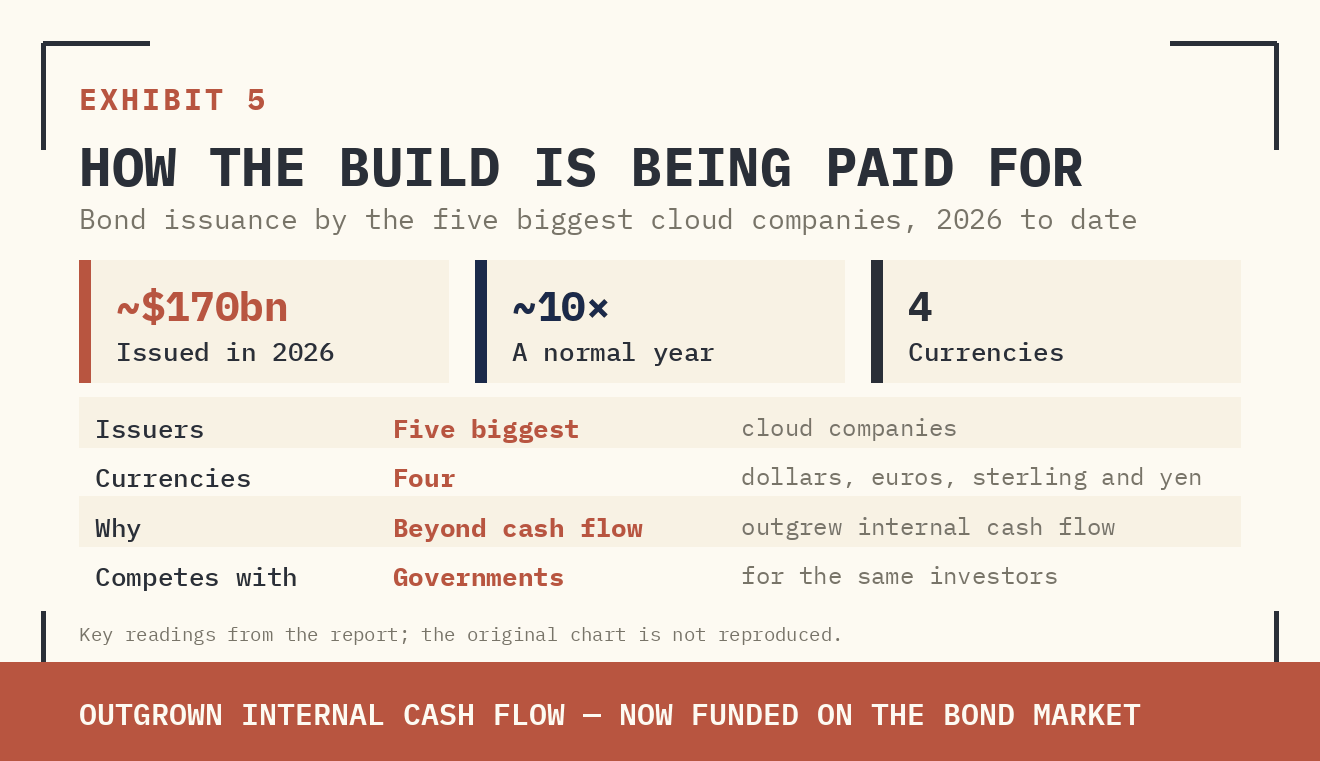
Hyperscale capex assumptions have moved in only one direction, and the funding is now visibly leaking out of the private balance sheet. Credit issuance tied to the build is large and still expanding, and the equity channel is now being tapped alongside it. The implication for duration is direct: the fiscal supply story that has weighed on DM long ends all year now has a second, private-sector leg competing for the same waning duration bid.
Supplied archive exhibit · original labels. Read alongside the editorial corrections.
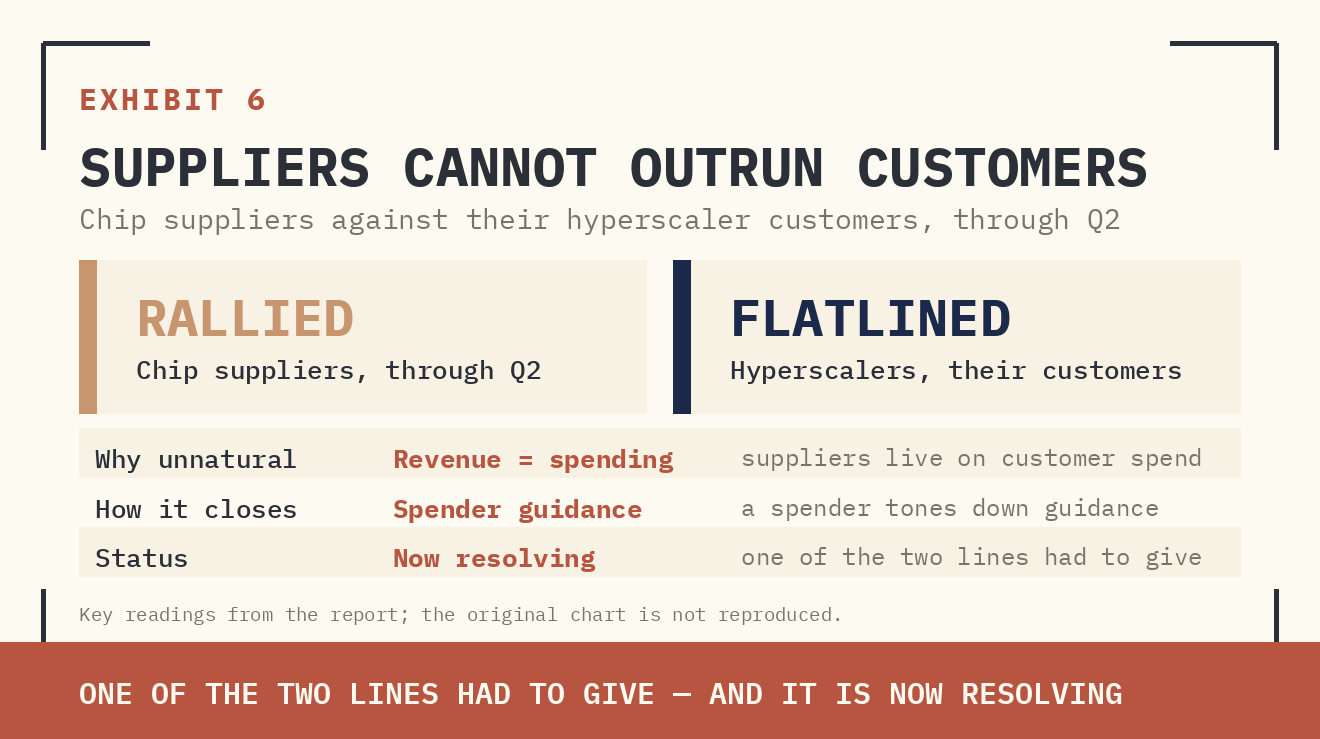
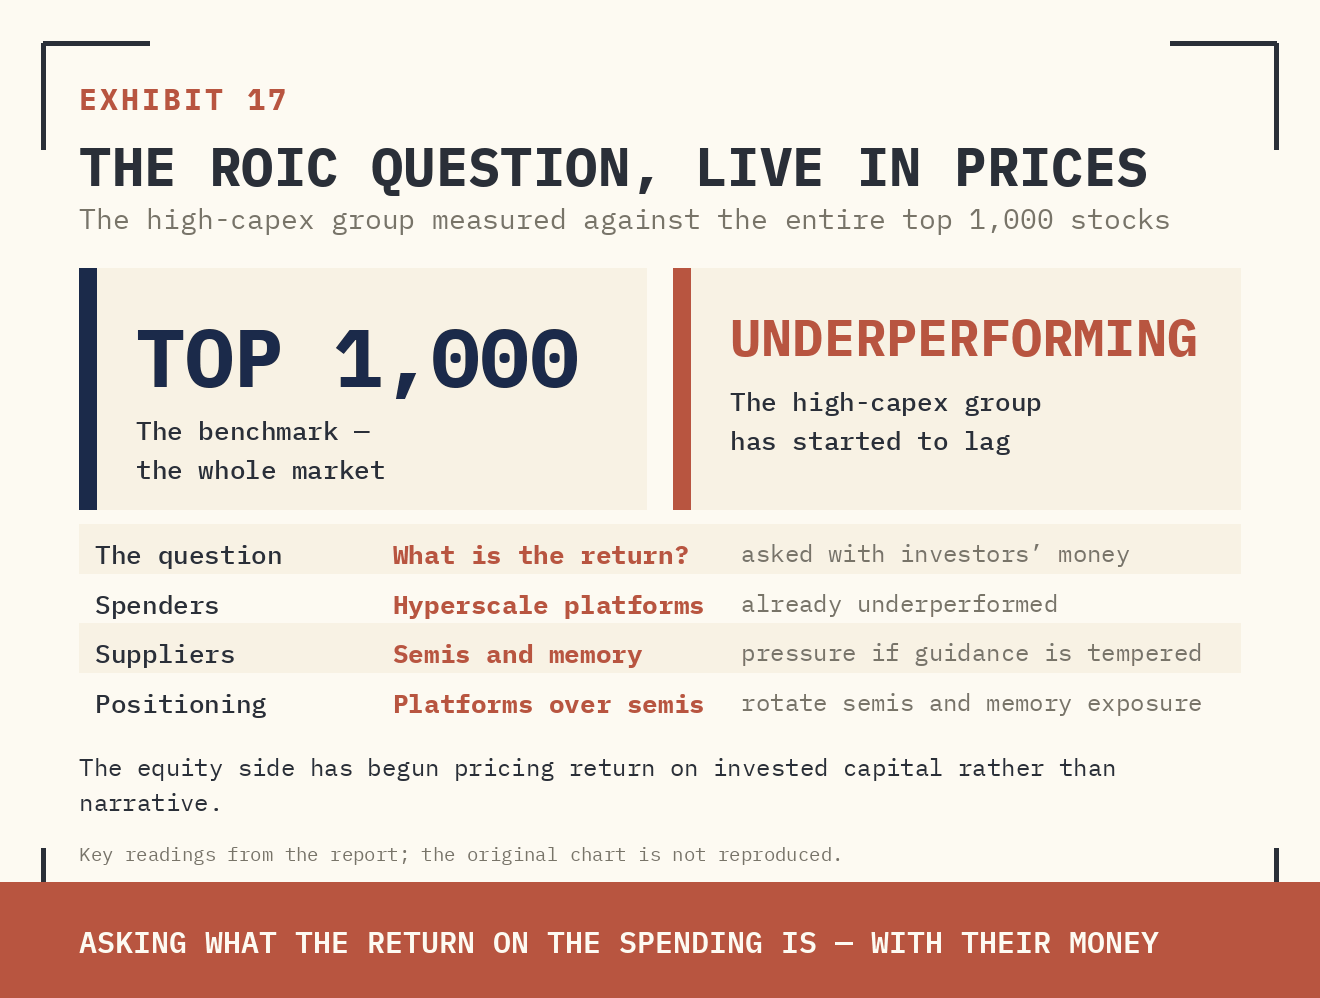
The equity market is running its own referendum on the same question. The rotation out of the AI capex spenders' suppliers and into the spenders themselves is the cleanest signal available that the equity side has begun pricing return on invested capital rather than narrative. The divergence between hyperscale platforms and the semiconductor complex — the latter wholly dependent on the former — had become unsustainable; these groups ebb and flow in opposite directions near the end of such divergences, and reconciliation arrives when the spenders tone down capex guidance or signal a change in direction. The excess-compute announcement was exactly that signal.
Supplied archive exhibit · original labels. Read alongside the editorial corrections.
Supplied archive exhibit · original labels. Read alongside the editorial corrections.
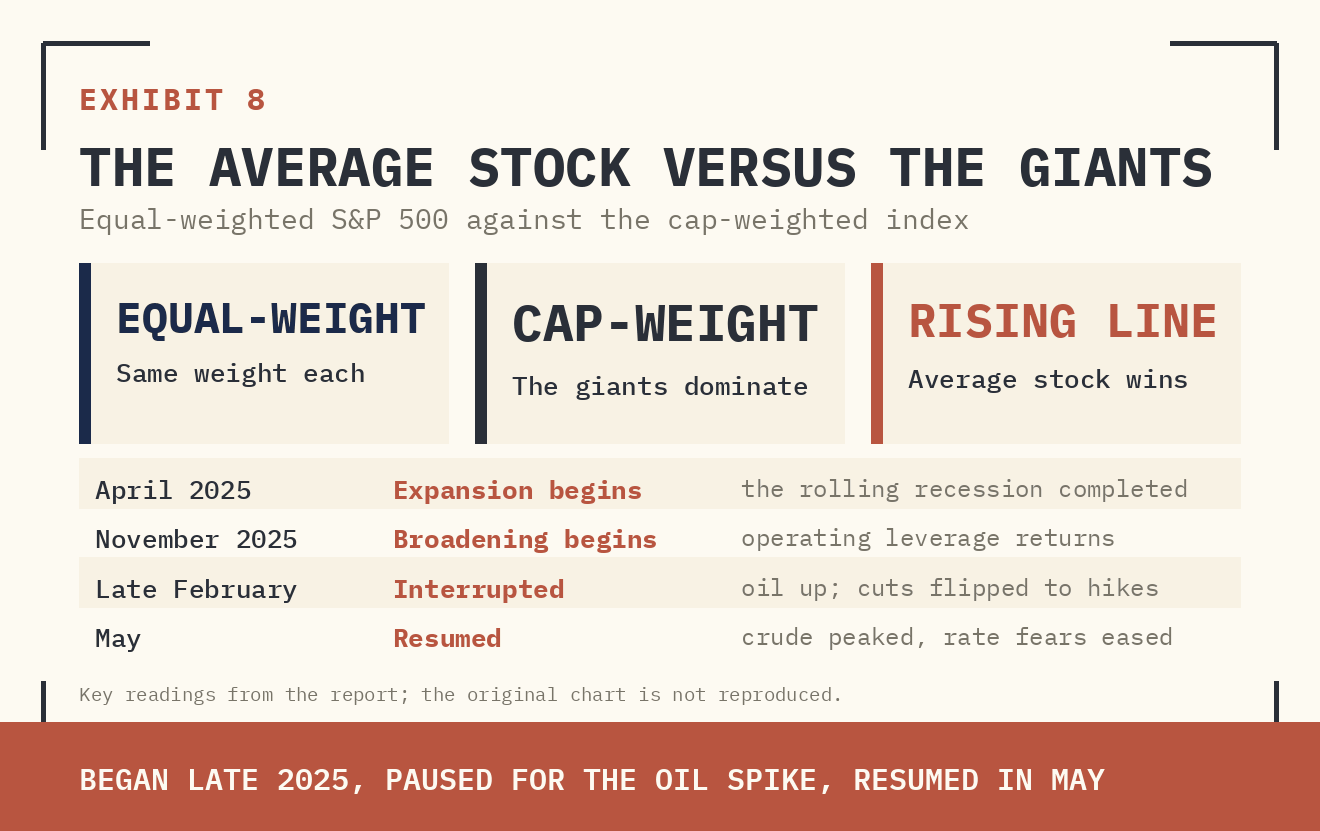
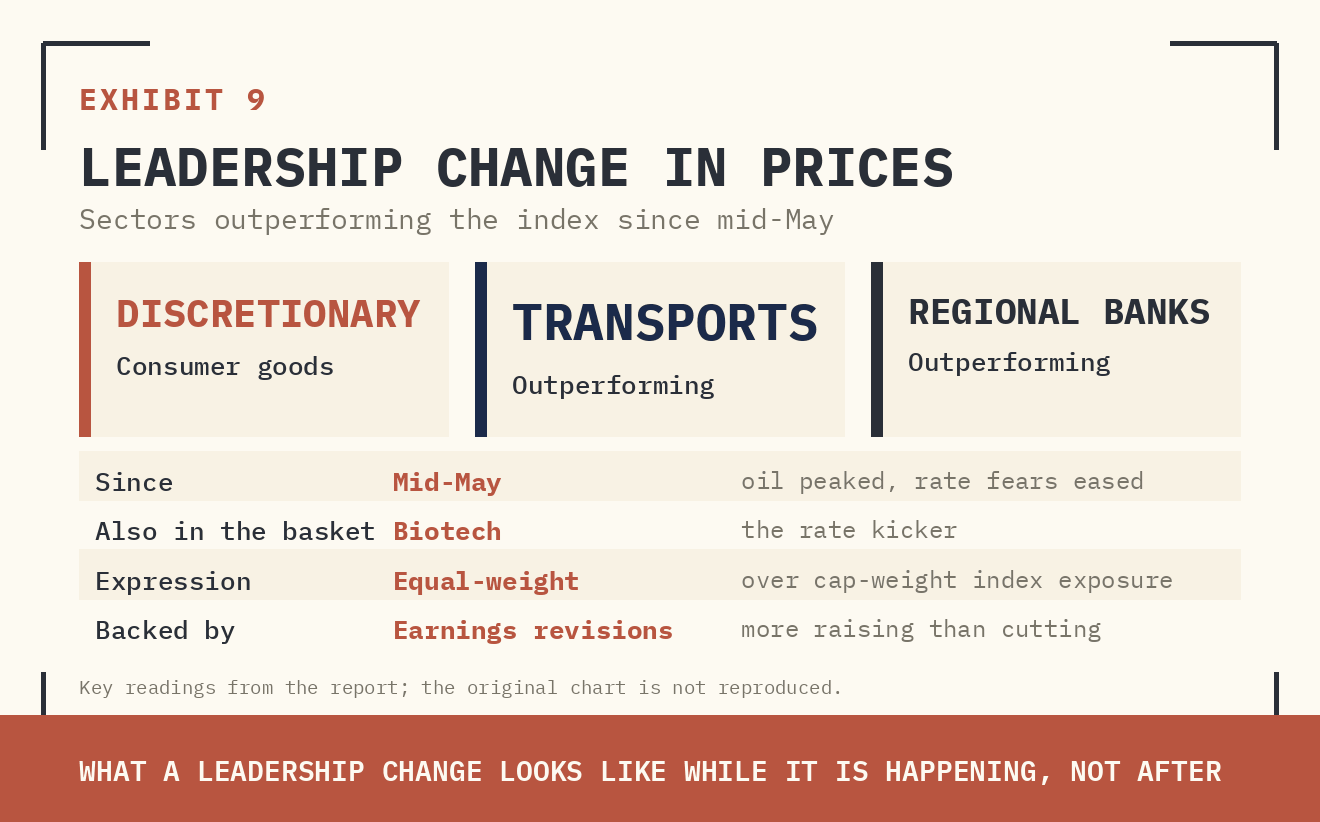
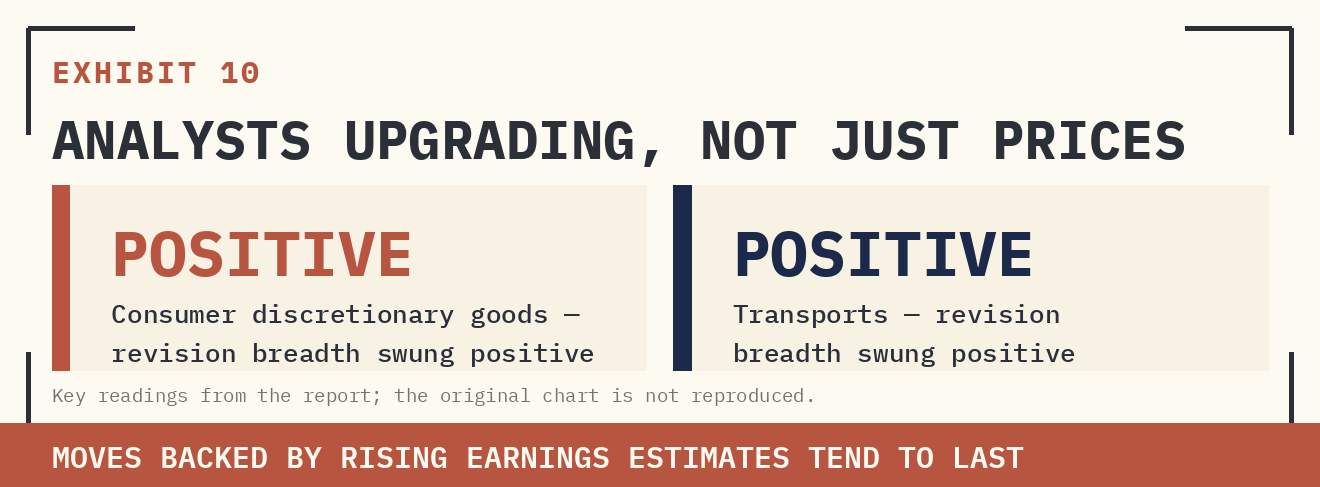
Beneath the AI complex, a broader rotation is compounding the flow. The economy entered a new expansion after the rolling recession completed in April 2025, and new expansions deliver classic operating leverage: revenue growth returning to cost-efficient companies, with earnings surprising to the upside in the laggard cohorts. That broadening began in November 2025, was interrupted by the Iran war in late February — oil surged, and pricing for cuts flipped to hikes — and has resumed since crude peaked in May. The steep fall in oil has stabilised rates, which is itself a driver of the rotation into lagging areas: consumer discretionary goods, transports, regional banks, and biotech. Structurally, this favours the equal-weighted index over the cap-weighted index.
Supplied archive exhibit · original labels. Read alongside the editorial corrections.
Supplied archive exhibit · original labels. Read alongside the editorial corrections.
Supplied archive exhibit · original labels. Read alongside the editorial corrections.
Figure 01 · Conceptual framework
Why an AI buildout reaches the yield curve
III. Risk
The physical bottleneck. If the stated capex numbers are realised, the build collides with power availability, grid capacity, skilled construction labour, and cooling. Each is a potential headwind to inflation normalisation. A capex boom that tightens real-resource markets while the central bank is trying to re-anchor inflation credibility is an uncomfortable combination for duration.
The unresolved verdict. The burden of proof now sits with whether the productivity gain emerges, and how long it takes. Until it does, more weight belongs on the known — more competition for capital, private and public, credit and equity — than on the promised destination.
The policy risk. A hike remains possible. It would burnish the Fed's inflation-fighting credibility at seemingly minimal cost. But it is optional rather than necessary — the energy move is working in the right direction, sequential inflation is expected lower from here, helped by PCE methodology changes — and there is a deeper question of whether hikes are even the right tool for a capex-driven cycle. The rate-sensitive sectors hikes actually reach, housing above all, are already visibly struggling. If the Fed moves, a sustained cycle beyond two to three hikes is hard to construct.
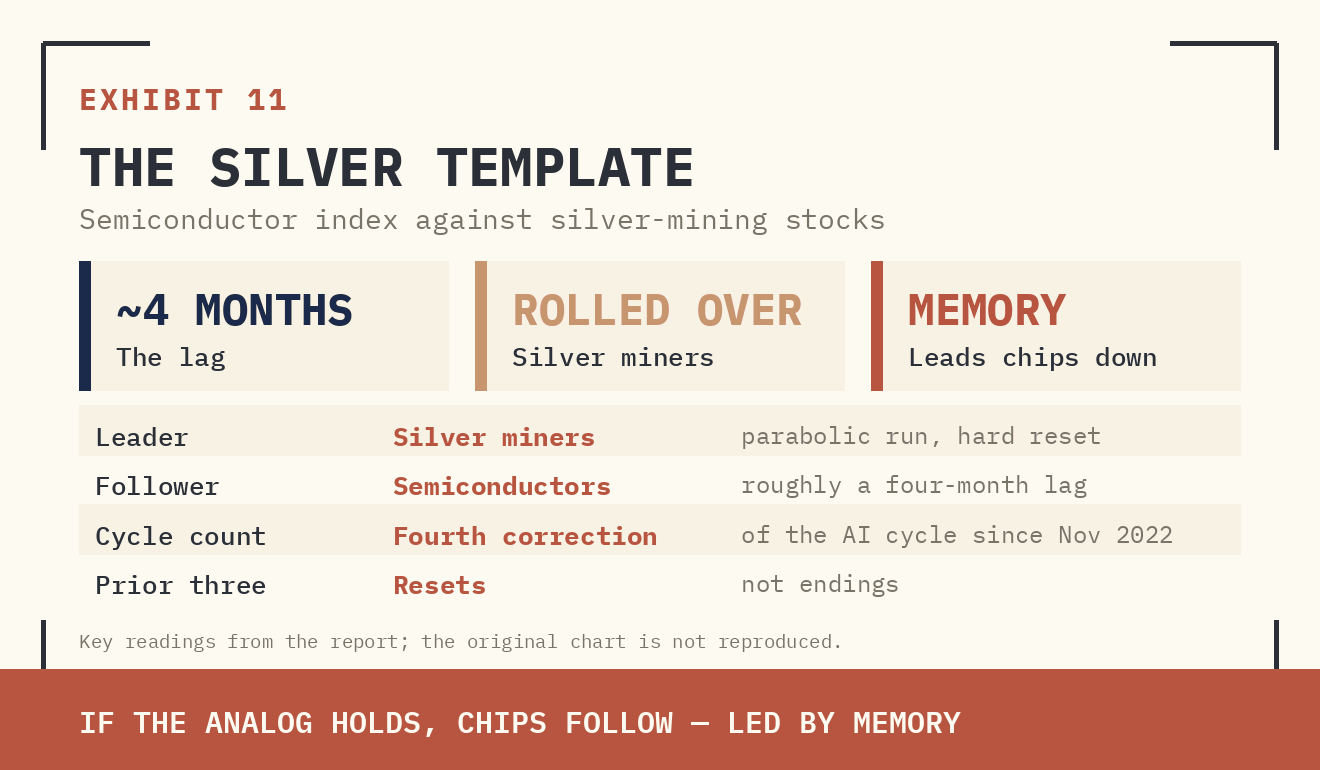
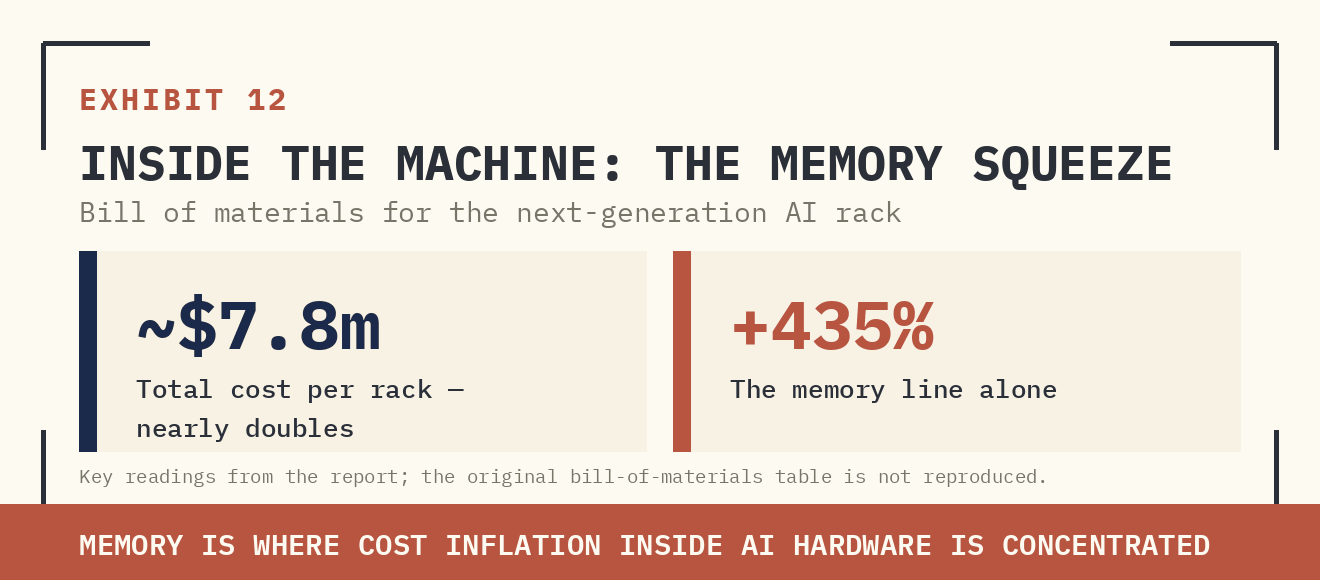
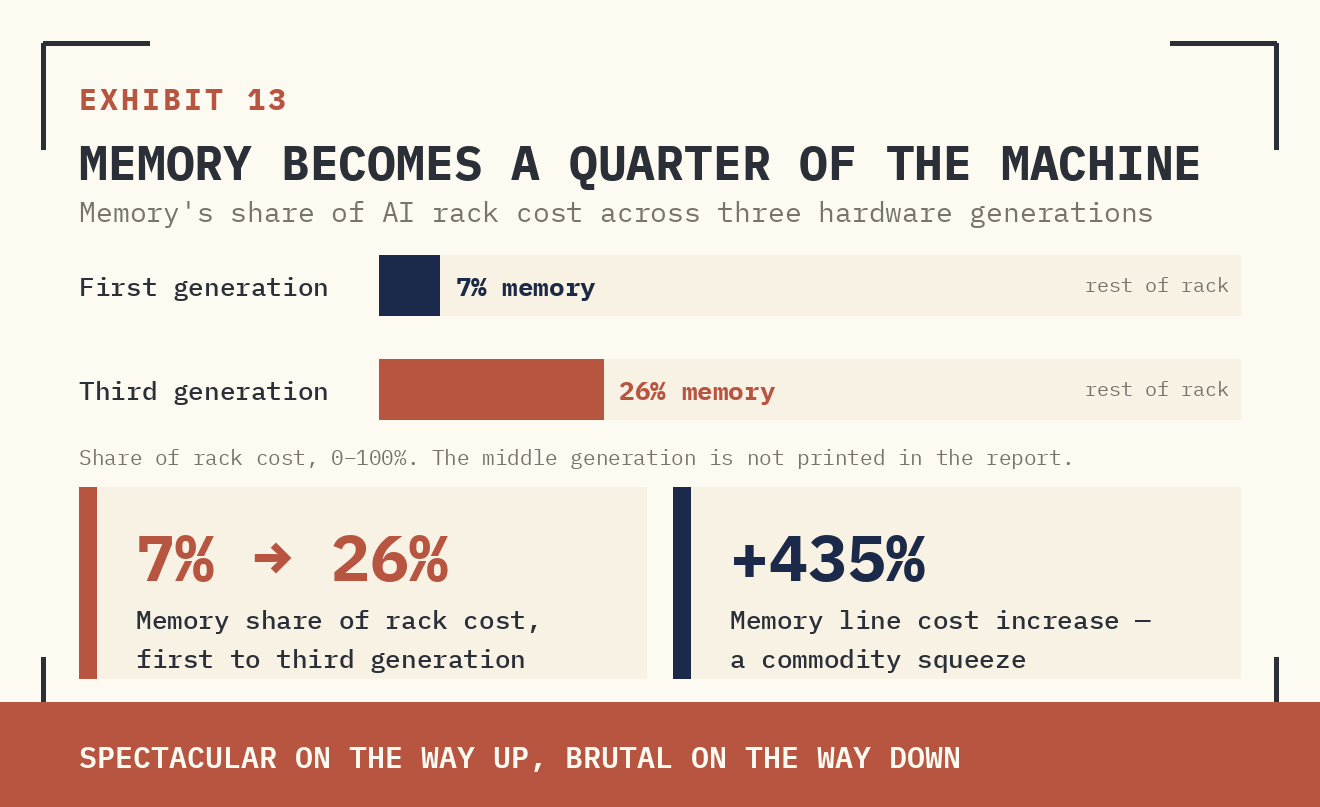
The commodity analogy. The memory subsector is the most commodity-like corner of the semiconductor complex, and its parabolic advance this year tracks the precious-metals-equity analog with uncomfortable fidelity: parabolic move, commodity underlier, wide price swings. That analog suggests the correction in semiconductors has further to run, led by memory. Peak rate of change in revisions breadth — not peak cycle — is the operative diagnosis; this is the fourth such correction since the AI cycle began in November 2022, and the prior three resolved as resets, not endings.
Supplied archive exhibit · original labels. Read alongside the editorial corrections.
Supplied archive exhibit · original labels. Read alongside the editorial corrections.
Supplied archive exhibit · original labels. Read alongside the editorial corrections.
IV. Price
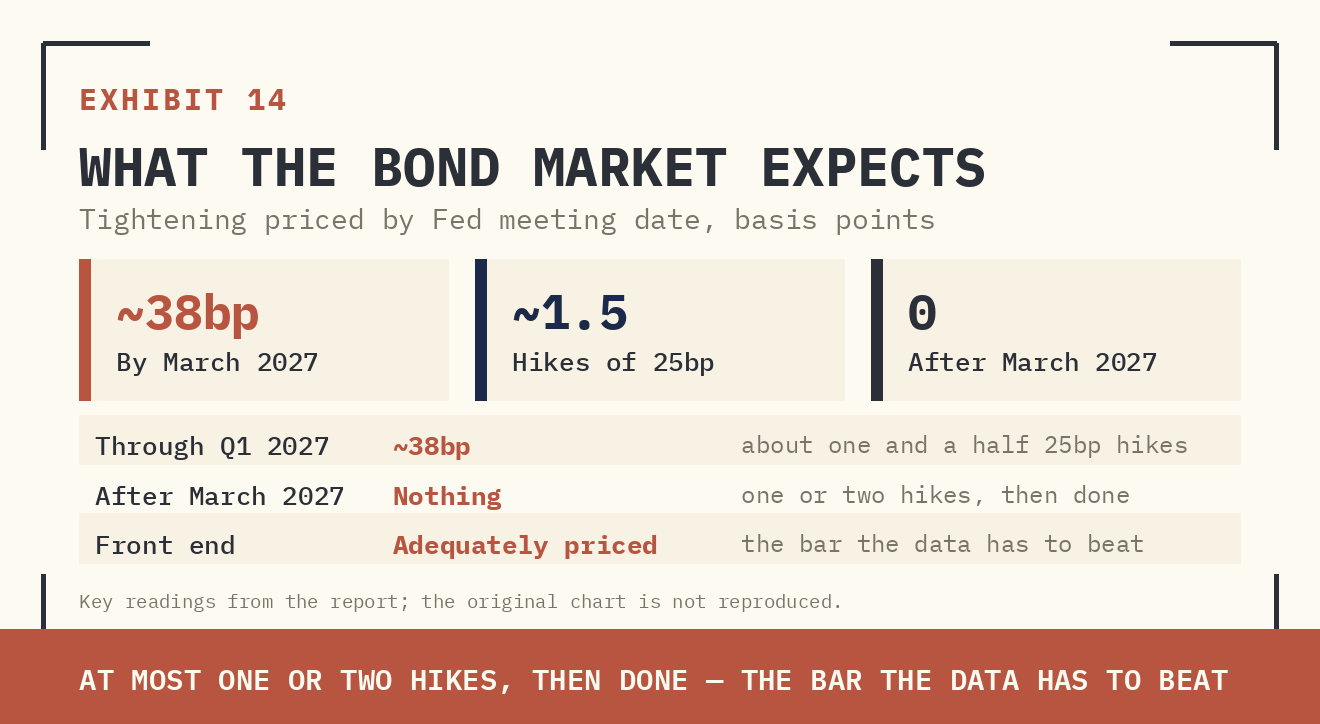
The bond market still carries roughly one and a half hikes through the first quarter of 2027. Against a backdrop of falling energy prices, peaking tariff-related inflation, and contained services and housing inflation — with core CPI likely to hold below three percent — that pricing looks adequately hawkish at the front end, and arguably too hawkish. A Fed that stays on hold is a positive surprise for equities via lower policy-rate expectations, and the recent outperformance of rate-sensitive cohorts may be the early signal, just as energy-equity underperformance front-ran the fall in crude.
Supplied archive exhibit · original labels. Read alongside the editorial corrections.
Supplied archive exhibit · original labels. Read alongside the editorial corrections.
Further out the curve, the cost-of-capital argument caps the upside. Rallies in the belly and long end of DM curves now run into two supply legs — fiscal and private — bidding for the same shrinking pool of duration demand. Rates markets need to price the build before they price the benefits, because there is materially more certainty today on the former than the latter.
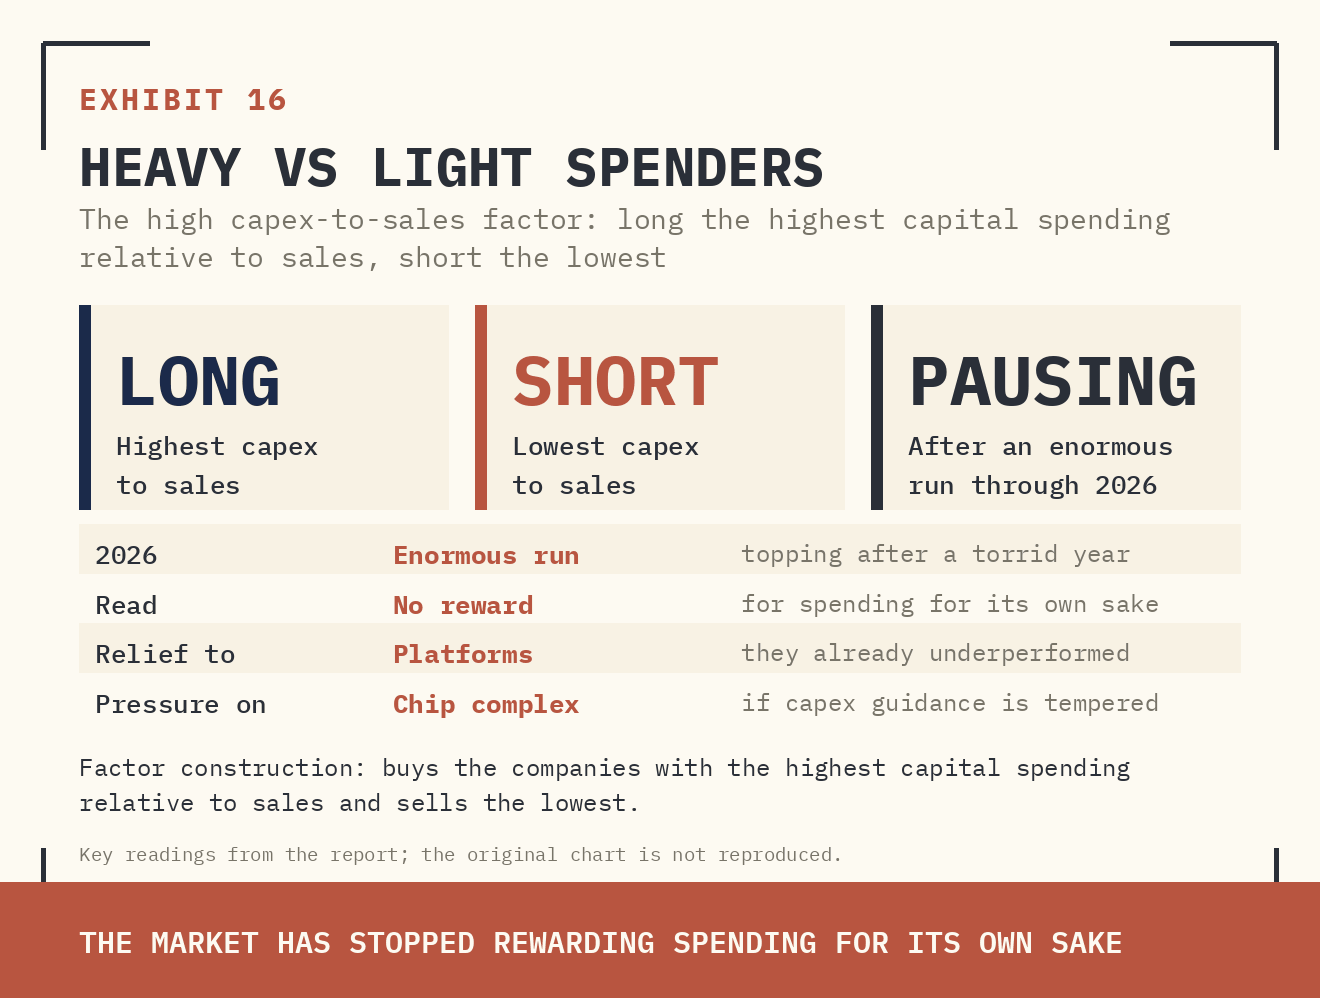
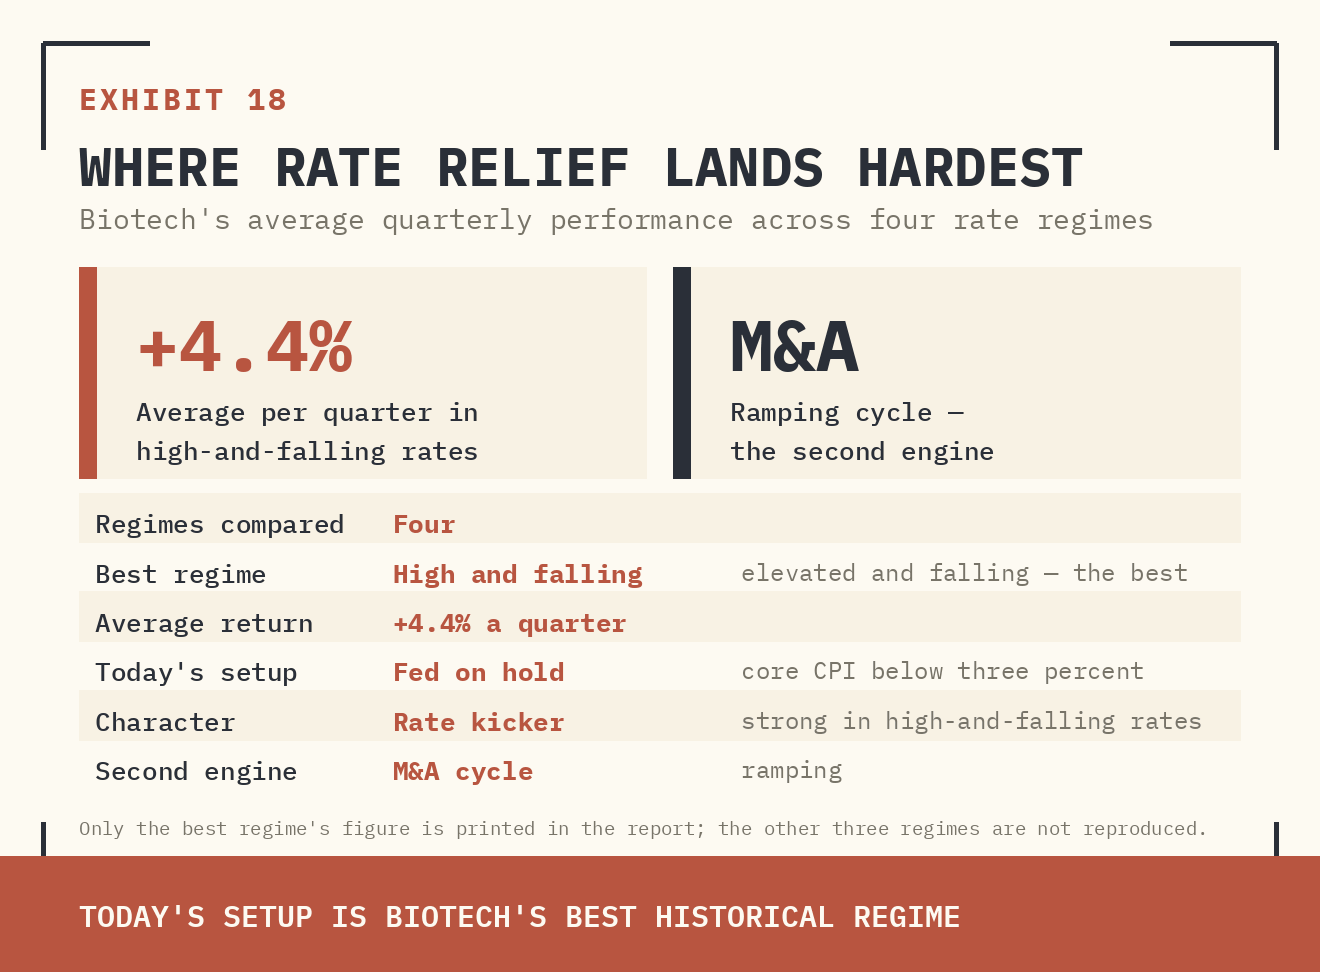
Within equities, the pricing asymmetry favours the spenders over their suppliers. Hyperscale platforms have already absorbed their period of underperformance as capex expectations ramped against them; the high capex-to-sales factor is topping after a torrid year, and any tempering of capex guidance from here transfers relief to the platforms and pressure to the chip complex. Biotech carries its own rate kicker: in elevated-and-falling rate regimes the group has historically delivered strong returns, and a ramping M&A cycle compounds the case.
Supplied archive exhibit · original labels. Read alongside the editorial corrections.
Supplied archive exhibit · original labels. Read alongside the editorial corrections.
Supplied archive exhibit · original labels. Read alongside the editorial corrections.
Figure 02 · Qualitative comparison
Two parts of the curve, two questions
| Segment | Main question in the report | Relevant evidence |
|---|---|---|
| Front end | What will the central bank do next? | Inflation, employment and policy decisions |
| Belly and long end | What return attracts duration capital? | Issuance, real resources and investor demand |
| Equities | Who turns spending into earnings? | Cash flows, margins and capital discipline |
V. Position
All positioning is expressed at sector and factor level, consistent with Buy Side Lens policy.
SLEEVE | SECTOR-LEVEL POSITION | HORIZON | DRIVER |
|---|---|---|---|
Rates — DM curves | Fade rallies in the belly and long end; the front end is adequately priced — hold front-end exposure, resist duration extension. | H2 2026 | Cost of capital / dual supply legs |
Equities — AI complex | Rotate semiconductor and memory exposure toward hyperscale platform exposure; treat the semis correction as ongoing, led by memory. | 3–6 months | Revisions-breadth peak / capex guidance |
Equities — broadening | Overweight consumer discretionary goods, transports, biotech, and regional banks; prefer equal-weight over cap-weight index exposure. | H2 2026 | New-expansion operating leverage |
Energy | Crude has peaked; avoid chasing energy equity strength — its earlier underperformance correctly led the commodity lower. | H2 2026 | Oil supply / rate stabilisation |
Watchlist | Inflation prints into September; hyperscale capex guidance revisions; power, grid, and construction-labour bottleneck data. | Rolling | Decides the hike question |
VI. Two Desks, One Question
This report consolidates two sell-side views published in the same week — the Goldman Sachs macro desk's H2 roadmap and Morgan Stanley's equity strategy note. They approach the same underlying question from opposite ends of the capital structure. Companion desk notes covering each in full detail accompany this report. The comparison below is the map.
THE MACRO DESK (GOLDMAN SACHS) | THE EQUITY DESK (MORGAN STANLEY) | |
|---|---|---|
The question | Who funds the build — and what does that do to interest rates? | Who leads the equity market while the build is being questioned? |
Core call | The AI capex cycle raises the cost of capital during the build; DM duration rallies are capped. | The broadening resumes; rotate out of semis into hyperscalers and the lagging average stock. |
The Fed | Could hike — optional, not necessary; any cycle stops at 2–3 moves; prefers fading duration rallies. | Stays on hold all year; rate pricing is too hawkish; a hold is a positive surprise for equities. |
AI framing | A railway-scale infrastructure boom; price the build before the benefits. | A mid-cycle reset — the fourth correction since 2022, not the end of the capex cycle. |
Expression | Rates: hold the front end, fade rallies in the belly and long end. | Equities: hyperscalers over semis; discretionary goods, transports, biotech, regional banks; equal-weight over cap-weight. |
Key evidence | Record hyperscaler credit issuance and equity taps; physical bottlenecks in power, grid, labour, cooling. | Peak revisions breadth in semis; the silver analog; Meta's excess-compute sale; broadening in prices and earnings revisions. |
Where they agree. Both desks treat the hike as shallow and optional, both treat the semiconductor correction as real rather than noise, and both place the capex-funding question at the centre of the second half. Neither calls the end of the AI cycle.
Where they collide — and why both can be right. The apparent contradiction is on rates: the macro desk caps duration rallies while the equity desk expects rate expectations to fall. Resolve it by tenor. The equity desk's argument lives in the front end — the priced hikes that never arrive get unwound, which is bullish two-year paper and rate-sensitive equities. The macro desk's argument lives in the long end — the dual supply of fiscal and private duration caps ten- and thirty-year rallies regardless of what the Fed skips. Both legs together produce one clean macro read: a steeper curve.
Supplied archive exhibit · original labels. Read alongside the editorial corrections.
VII. The Lens View
The destination may still be the software-cycle one — disinflation, better margins, a lower neutral rate. But the journey is a capex cycle with a railway-scale physical footprint, and it has to be funded. That competition for capital — private and public, credit and equity — is the story of the second half, and it is what caps how far belly and long-end rallies can extend. In the front end, payrolls have made the hike optional rather than necessary; the inflation prints will decide September. And where the two desks appear to disagree, the reconciliation is the trade: front end rallies as phantom hikes unwind, long end stays pinned by supply — the curve steepens.
We keep describing AI as a software cycle while building it like a railway. Price the build before the benefits — there is more certainty in the former than the latter.


