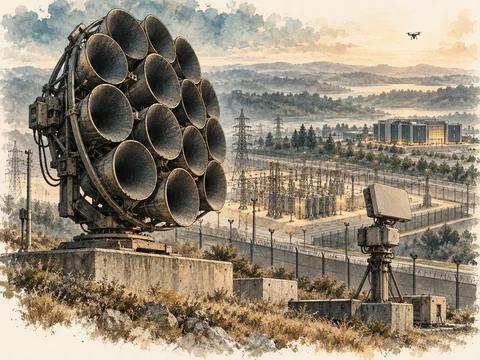
Updated synthesis · 8 October 2026. This article now combines the original escalation-prevention framework with The Price of Staying, the 22 September report on the economic cost of sustained military commitments. The central judgement survives the refresh: a state can finance continuing operations while losing flexibility because its scarce equipment, people and maintenance capacity are committed elsewhere.
What changed after the September report
The energy direction changed. The US Energy Information Administration’s 6 October outlook estimates Middle East crude-production shut-ins at 4.8 million barrels a day in September, down from 5.8 million in August and 10.9 million at the May peak. September Brent spot oil averaged $114 a barrel. The agency forecasts $105 for the fourth quarter; that final number is a conditional forecast, not a recorded price. The new data replace the September report’s headline about a July-to-August increase in shut-ins. EIA, October outlook.
Falling shut-ins do not imply that the economic shock has ended. Restoration, shipping confidence, insurance, inventory rebuilding and the price paid by an importer adjust at different speeds. The decision should therefore distinguish physical supply recovery from the cost of buying and transporting that supply. This is an analytical interpretation of the updated observations, not an EIA claim about military success.
Keep the four cost ledgers separate
The September report’s most useful contribution is its insistence on the denominator. A naval presence estimate, incremental war expenditure, a weapons inventory and wider economic damage are four different ledgers.
| Ledger | Evidence retained | Correct interpretation |
|---|---|---|
| Supplied naval model | $7.103 billion across six modelled phases through mid-September | An unaudited reconstruction in the original report, not total federal spending |
| Supplied second-blockade video | $2.009 billion at its displayed endpoint; August increment $992 million | Historical model observations; $992m / 31 = $32m a day |
| CBO incremental defense costs | About $38 billion as of 1 August, published 15 September | CBO estimate with a specific perimeter and uncertainty; not an October running total |
| Opportunity cost | Capacity unavailable for a different commitment | Requires system-specific readiness and replacement evidence; cannot be read from a dollar total |
CBO explicitly warns that its cost categories are not directly comparable or summable. It gives conditional additional monthly costs of $2 billion at the lower May–June intensity and $3 billion at roughly July’s intensity. Those estimates exclude some already-budgeted operating costs and are uncertain. CBO, 15 September 2026.
Accordingly, this edition does not add the naval video, CBO estimate, an alternative media estimate or macroeconomic losses together. It also does not extrapolate the video’s daily rate to 8 October and label the result observed expenditure. Twelve additional months at CBO’s two conditional monthly rates would equal $24 billion or $36 billion before any separate financing calculation; that is scenario arithmetic, not a forecast.
The scarce resource determines freedom of action
The source report illustrates capacity falling from 100 to 75 normalized units. A pair of commitments needing 45 units each fits within 100 but exceeds 75. The point is the change in feasible choices; none of those numbers measures American readiness. Actual constraints are multidimensional: crews, maintenance slots, interceptors, support, access and lift cannot be exchanged without limits.
A credible replacement model is a stock-flow identity:
Usable inventory next period = usable inventory now + accepted deliveries − operational use − retirements and other losses.
A contract award affects future supply, while an accepted delivery changes the usable stock. A factory’s nameplate capacity may differ from reliable output. Production ramp-up, qualification, supplier inputs and delivery acceptance need separate evidence. The September report’s graphic dated 12 August is therefore retained in the source archive as a dated depiction, not reused as a current deployable inventory.
The same logic applies to people and platforms. Extending a deployment can preserve presence now and increase later maintenance or retention pressure. Returning a ship does not instantly restore a complete ready force. The policy question is what commitment remains sustainable while retaining credible options elsewhere.
Integrate endurance with escalation prevention
The older framework below concentrates on communication, civilian protection and reversible commitments. The newer cost research makes that framework more concrete: a pause can reduce firing without ending expenditure or rebuilding exhausted capacity. A durable off-ramp should be evaluated across the political, human, operational and economic clocks.
| Review question | Evidence that would improve the answer |
|---|---|
| Does lower violence release usable capacity? | Rotation and maintenance completion, with dated definitions |
| Does restored supply improve commercial access? | Delivered volumes, freight, insurance and reliable transit |
| Are essential civilian systems recovering? | Service continuity, assistance reaching people and credible local reporting |
| Is the settlement more durable than a temporary pause? | Observable compliance, functioning communication and dispute handling |
A financially affordable posture may still be strategically expensive. Equally, a costly presence may deter a worse outcome. The research identifies that trade-off; it cannot establish the counterfactual benefit from spending alone.
Retained escalation-prevention framework
Regional crises become dangerous when actors misread one another’s objectives, feel compelled to demonstrate resolve and lack credible ways to stop. The historical Iran planning exercise recognises pressure to respond to external threats while avoiding a wider conflict. Its most useful public-policy question is how to preserve security and bargaining space without allowing a sequence of limited actions to produce uncontrolled escalation.
Historical conflict-risk assessment · planning horizon 2025–2040
This report assesses that problem at the level of crisis governance, diplomacy and civilian protection. Event descriptions in the source form part of a 2025-based scenario exercise and are not independently verified here as current developments.
Distinguish an action’s purpose from its interpretation
An intended message can be interpreted differently
| Aspect | Retained observation |
|---|---|
| Reassurance at home | An action intended as reassurance at home can appear threatening abroad. |
| Public statement | A public statement intended to limit a response can be read as a commitment to act. |
| Defensive measure | A defensive measure can be interpreted as preparation for an offensive step if communication and trust are weak. |
This creates an interaction problem. Each side responds to what it believes the other side intends, not necessarily to the intention the other side believes it conveyed. The source’s emphasis on changing red lines and uncertainty about external decisions is relevant, but it should not be turned into a confident claim that a particular actor will always escalate or always stop.
A careful assessment records the actor, objective, perceived constraint and competing interpretations. It distinguishes evidence about capabilities from assumptions about willingness. The existence of a capability does not prove an intention to use it, and a public threat does not establish the probability of action.
Figure 01 · Qualitative comparison
Four ledgers, four questions
| Ledger | Interpretation |
|---|---|
| Operating model | A historical reconstruction with its own perimeter |
| Public expenditure | An estimate with an explicit cost cutoff |
| Opportunity cost | A constraint on alternative choices |
| Economic effect | A separate transmission mechanism |
Domestic pressure can narrow room for compromise
The exercise links external threat to national solidarity and pressure on leadership to show resolve. It also recognises the possibility of public fatigue and economic discontent. Both mechanisms can operate at different times or among different groups.
An initial rally in support does not guarantee durable consent for a prolonged confrontation. As costs accumulate, employment, prices, services and personal safety can become more important to public judgement. Conversely, external pressure can strengthen institutions that argue against accommodation.
The analytical implication is that domestic politics should be treated dynamically. A strategy based on a presumed permanent public reaction is fragile. Crisis management needs information about actual social and economic costs, including effects on people who are least visible in official reporting.
Indirect relationships create control problems
The source gives considerable attention to regional networks of armed non-state actors. The public synthesis does not retain instructions for supporting them. Their relevant role in a conflict-risk assessment is the uncertainty they can introduce into control and attribution.
A relationship does not imply complete command over another actor’s choices. Local objectives, internal factions and differing exposure to retaliation can produce actions that are inconsistent with a patron’s preference for restraint. Other states may nevertheless attribute those actions to the patron, increasing pressure for a response.
This can create escalation even when the principal actors would prefer to avoid a wider war. A neutral assessment should therefore examine uncertainty of control, disputed attribution and the risk of commitments made through relationships that cannot reliably deliver compliance.
Reducing violence requires political processes and accountable security arrangements that respect civilian protection. It does not require publishing methods for making armed networks more operationally effective.
Maritime disruption has wider costs
The exercise treats concentrated maritime routes as sources of strategic importance and vulnerability. At a high level, disruption to commercial navigation can affect energy supply, insurance, transport time and regional livelihoods well beyond the direct parties to a dispute.
The conflict-risk significance is that a local incident can draw in actors with otherwise limited involvement. Protecting commercial activity and avoiding ambiguous threats to it can therefore preserve diplomatic space. This report does not assess methods for closing routes, deploying forces or exploiting maritime vulnerabilities.
For civilian institutions, the appropriate planning questions concern continuity, communication and people’s safety. Which services depend on uninterrupted shipping? How would delays affect essential goods? What information would firms and households need? These questions translate a geopolitical risk into assessable consequences without treating disruption as a policy tool.
Crisis communication should reduce ambiguity
Communication is useful when it makes objectives and limits more understandable. It is less useful when it becomes an exercise in public escalation or when private assurances are repeatedly contradicted by actions.
At the strategic level, credible channels can help clarify incidents, distinguish authorised policy from ambiguous events and communicate humanitarian needs. The institutional requirement is continuity: channels should not depend entirely on personal relationships that disappear during leadership changes.
The source refers to diplomatic engagement through regional states. The public analytical lesson is that interlocutors can be valuable when parties do not communicate directly, but mediation requires trust and a clear understanding of its limits. An intermediary cannot guarantee that every actor will comply.
The numerical de-escalation target needs a definition
One source strategy aims for a 30% reduction in cross-border militia clashes alongside a 25% increase in regional trade. These are scenario targets, not observed improvements. They express a proposed link between lower violence and greater economic interaction.
The violence target requires a baseline, geographic scope, event definition and consistent reporting. A reduction in the number of incidents can coexist with an increase in severity or civilian harm. A comprehensive indicator should therefore examine casualties, displacement, attacks on essential services and the persistence of ceasefire arrangements, where reliable evidence is available.
The trade target also requires definition. Higher nominal trade value may reflect prices rather than more goods or broader relationships. More trade can create interests in stability, but it does not automatically overcome security disputes. The relationship is conditional and can run in both directions.
Proposed indicators and the limits of what they establish
| Proposed indicator | What it could show | What it cannot establish alone |
|---|---|---|
| Fewer reported clashes | Lower event frequency under a stable definition | Lower severity or durable settlement |
| More regional trade | Greater commercial interaction | Political trust or conflict prevention |
| Functioning dialogue | Availability of communication | Compliance with agreements |
| Restored services | Improved civilian conditions | Resolution of underlying disputes |
The targets become useful when paired with these measurement limits.
Protect civilian systems as an objective in itself
The exercise’s adverse scenarios include infrastructure disruption, migration and social hardship. These should be assessed as harms to prevent, not merely variables in a contest of state endurance.
Water, health care, electricity, food distribution and communications have interconnected effects. A disruption in one can weaken several others. Humanitarian access and credible public information can reduce uncertainty and suffering, while restoring services can support stability without requiring a political settlement on every disputed issue.
Assistance should be lawful, accountable and voluntary, with particular attention to people affected by displacement and service loss. Public authorities should assess whether support actually reaches those in need and whether affected communities can raise concerns without increasing their vulnerability.
Figure 02 · Conceptual framework
Commitment consumes more than cash
How the parts connect
- Continuing commitmentrequiresUse and wear
- Use and wearreducesUsable capacity
- ReplenishmentrestoresUsable capacity
- Usable capacityconstrainsStrategic choice
- Strategic choicesets scopeContinuing commitment
Preserve off-ramps without assuming easy agreement
An off-ramp is a credible way to reduce confrontation while allowing parties to explain the decision to their constituencies. It can involve limited agreements, verification of specific commitments or humanitarian arrangements that do not resolve the entire strategic dispute.
The difficulty is credibility. If one party expects concessions to be exploited without reciprocity, restraint can appear risky. If commitments are too broad or unverifiable, they may collapse under the first disputed incident. Smaller, observable steps can be easier to assess, but their design must remain tied to the actual diplomatic context.
This report does not propose negotiation terms for a live crisis. It identifies the analytical tests: clarity of obligations, monitoring, reciprocity, treatment of disputed events and continuity when leadership or external conditions change.
Integrate conflict risk with the broader scenarios
How the source scenarios change room for bargaining
| Aspect | Retained observation |
|---|---|
| Favourable scenario | In the favourable scenario, regional relationships and institutional adaptation create more room for bargaining. |
| Constrained stability | In constrained stability, communication remains possible but disputes and economic pressure persist. |
| Adverse scenario | In the adverse scenario, narrower external relationships and internal stress can increase the temptation to use confrontation to demonstrate strength. |
None of these mechanisms makes conflict inevitable. The source’s scenarios are best used to test whether institutions retain channels, credible information and less harmful alternatives under each condition. A system that can de-escalate only when the economy is strong is less resilient than one designed to maintain communication during pressure.
The analysis should also consider external actors’ changing incentives. A regional state may support de-escalation while disagreeing on other issues. Treating every relationship as permanently hostile or friendly can obscure such openings.
The strategic conclusion
The historical exercise supports an important tension: pressure to demonstrate resolve can conflict with the longer-term need to preserve economic capacity and diplomatic options. Managing that tension requires reliable information, accountable decision processes, communication and civilian protection.
The objective of this assessment is therefore to identify mechanisms that widen or narrow the path to restraint. Numerical targets for fewer clashes and more trade remain aspirations until their definitions and evidence are established. A credible reduction in conflict risk rests on behaviour and functioning institutions, not simply on declarations of deterrence or resolve.
Full original report: The Iran war's bill is not in dollars. It is in missiles, ships and crews.
The supplied original is retained below with dated editorial notes. The web analysis above and its corrections remain part of this reading edition.
Original Lens and publication context
The Iran campaign runs at $32m a day. The larger cost sits in missiles fired, ships worn and crews used up. Every number rebuilt and shown, for anyone who wants to understand geopolitics and military conflict through numbers.
- The bill is easy to pay in dollars and hard to pay in kind: missiles, ready crews, repair slots and open sea routes do not come back when the money does.
- Time, not intensity, drives the naval bill: 75.3% of $7.103bn was spent after the 7 April combat phase, at a flat $31m to $36m a day.
- Missile stocks grow only when delivered rounds outnumber fired rounds: at 620 PAC-3 MSE a year, a 1,200-round gap takes 1.9 to 5.7 years to close, or never closes.
- The blockade raises the price of the fuel the fleet burns: shut-in crude rose 34% and the oil price rose 8.3% from July to August.
- Another year at today's rate would cost $24bn to $36bn before interest; repair, trade and politics each run on their own clock.
The Price of Staying · Iran, US military capacity and strategic freedom
$2.009bn Naval model Cost of the second blockade, 14 Jul to 15 Sep, in the naval cost model. [V1] | $32m/day August average Rebuilt from month-end checkpoints. One-day peak of $42m on 19 Aug during a carrier changeover. [V1; C2] | +34% Oil shut in Crude left unproduced because it cannot move or sell: 5.0 to 6.7 million barrels a day (mb/d), July to August. [S3; C8] |
Three questions / Direct answers
What this war commits America to.
Question | Answer | The number |
|---|---|---|
1. What does the commitment use up? | The same scarce things every time. Ships on station cannot be elsewhere. Missiles fired and repairs delayed are already spent. Choice is lost where needs overlap, not where money is spent. | Cut capacity from 100 to 75 units and a 45 + 45 split (90) no longer fits. [C1; p.3] |
2. What does the blockade cost beyond the daily rate? | Five separate costs at five speeds: operations, repair, borrowing, shipping and delayed investment. The daily rate is the smallest of them. | 12 months × $2bn or $3bn = $24bn or $36bn, before interest. A what-if, not a forecast. [S1; C10; p.6] |
3. How long to replace the missiles used? | Years. Rebuilding stocks of interceptors (missiles that shoot down missiles) probably takes at least five years, even with new factories. First deliveries come sooner. Each missile type has its own queue. | Order-to-delivery lag: 3 to 5 years. It overlaps the rebuild; it does not add to it. [S1; C6; p.4] |
$32m a day buys presence. It does not buy back a single missile.
Evidence cutoffs vary: inventory estimate 12 Aug; naval cost series to 15 Sep; Congressional Budget Office (CBO) estimate 15 Sep, data through 1 Aug; EIA oil outlook 9 Sep, model cutoff 3 Sep. Tags in brackets: sources (S), naval series (V), infographic inputs (I), our calculations (C); all listed on page 7. No classified readiness data.
01 / The naval ledger
The quiet months cost nearly five times the fighting.
Six phases, 239 days, one rounded cost model. Days are counted inclusively: (end − start) + 1. [I2; C3]
Phase | 2026 dates | Days | Phase cost | Per day | Share of total |
|---|---|---|---|---|---|
Build-up | 20 Jan – 27 Feb | 39 | $652m | $16.7m | 9.2% |
Initial combat | 28 Feb – 7 Apr | 39 | $1,100m | $28.2m | 15.5% |
First pause | 8 – 12 Apr | 5 | $126m | $25.2m | 1.8% |
First blockade | 13 Apr – 18 Jun | 67 | $2,400m | $35.8m | 33.8% |
Inter-blockade period | 19 Jun – 13 Jul | 25 | $825m | $33.0m | 11.6% |
Second blockade | 14 Jul – 15 Sep | 64 | $2,000m | $31.3m | 28.2% |
Six phases | 20 Jan – 15 Sep | 239 | $7,103m | $29.7m | 100% |
Costs are rounded model estimates, not audited spending. After 7 April the model shows $5,351m against $1,100m for initial combat: 4.9 times. The moving series on page 3 ends the same phase at $2,009m; that and $2,000m are one phase, not two costs.
$7.103bn Sum of six phases $652m + $1,100m + $126m + $2,400m + $825m + $2,000m. [C3] | 75.3% Spent after 7 April $5.351bn / $7.103bn. A share of this naval model, not of the whole war. [C3] | $951m The two pauses $126m + $825m over 30 days = $31.7m a day. Pausing did not stop the clock. [C3] |
Supplied archive exhibit · original publication context.
Ships stay at sea during a pause. Aircraft still need support. Crews still rotate. The two pauses cost $31.7m a day. The two blockades cost $35.8m and $31.3m a day. Lower intensity cut the rate by a few million dollars a day. It did not stop the clock.
The ledger prices presence. It does not price what the presence achieved. It cannot say whether a quieter posture kept deterrence or bought time to talk.
The opening strike gets the attention. The months after it decide the bill.
02 / The moving series
Same rate every day. The total keeps climbing.
Second-blockade cost, 14 Jul to 15 Sep, read at dated checkpoints. Repeated frames counted once, never as new spending. [V1; C2]
Displayed date | Daily $m | Cumulative $m | Δ vs prior |
|---|---|---|---|
31 Jul | 32 | 583 | — |
13 Aug | 32 | 1,002 | +419 |
18 Aug | 32 | 1,162 | +160 |
19 Aug | 42 | 1,204 | +42 |
20 Aug | 31 | 1,235 | +31 |
31 Aug | 31 | 1,575 | +340 |
13 Sep | 31 | 1,976 | +401 |
14 Sep | 32 | 2,009 | +33 |
15 Sep | 32 | 2,009 | 0 |
Values are model outputs rounded to $1m, so differences carry rounding. The 19 Aug peak is the day three carriers and their air wings were on station at once; the days either side show two.
Figure 03 · Qualitative comparison
Judge an off-ramp across different clocks
| Clock | Review question |
|---|---|
| Political | Do commitments reduce ambiguity? |
| Human | Are essential civilian systems protected? |
| Operational | Can resources recover? |
| Economic | Can normal activity resume reliably? |
C2 / SERIES CALCULATIONS
August rate. (1,575 − 583) / 31 = $32.00m a day. August added $992m. Month-end checkpoints stop looped frames being counted twice.
Bridge. 583 + 992 + 434 = $2,009m. July part $583m; September part $434m (2,009 − 1,575).
Rotation peak. 42 / 32 − 1 = 31.25% above the day before. Against the whole total: (42 − 32) / 2,009 = 0.50%. A local comparison, not a cause of the bill.
Endpoint. $2,009m appears on both 14 and 15 Sep, so the series cannot show a separate zero-cost day. 2,009 / 64 = $31.39m; 2,009 / 63 = $31.89m. The $0.50m gap is a counting choice, not a change in forces. We anchor on the clean August month.
03 / Three ledgers, one rule
Three totals for one war. Never add them.
Ledger | Value / cutoff | What it counts |
|---|---|---|
Naval deployment model [I2] | $7.103bn | The running cost of the ships and aircraft pictured on station. Includes their normal costs; rounded by phase. |
CBO war estimate [S1] | $38.1bn | Extra defence cost above normal, plus the cost of replacing what was used; fuel counted on a fiscal-year basis. |
CENTCOM snapshot, as reported [S2] | $43.6bn | Includes $28.1bn of munitions. Reported 18 Sep; the original is not public; the scope may differ from CBO's. |
CBO category [S1] | $bn | Share | What it means |
|---|---|---|---|
Munitions replacement | 21.7 | 57.0% | Money has to become delivered missiles. |
Extra flying | 10.4 | 27.3% | Flying hours use up parts and people. |
Fuel-price effect | 2.7 | 7.1% | Dearer oil raises the fleet's own fuel bill. |
Lost equipment | 1.9 | 5.0% | Kit destroyed; counted separately in the budget. |
Other operations | 1.5 | 3.9% | Extra activity above normal. |
Components / total | 38.2 / 38.1 | — | $0.1bn is rounding, not a missing item. |
Interceptors alone: $13.1bn = 34.4% of the $38.1bn. All munitions: 57.0%. Replacing what was fired restores the old stock. It adds no new capacity. [C4]
Left out of the CBO figure: rebuilding bases, extra wear on kit, future veterans' care. The Pentagon did not supply the data CBO asked for. These are estimates, not a cash count. [S1]
04 / The geometry of capacity
Cut the capacity and the same plan stops fitting.
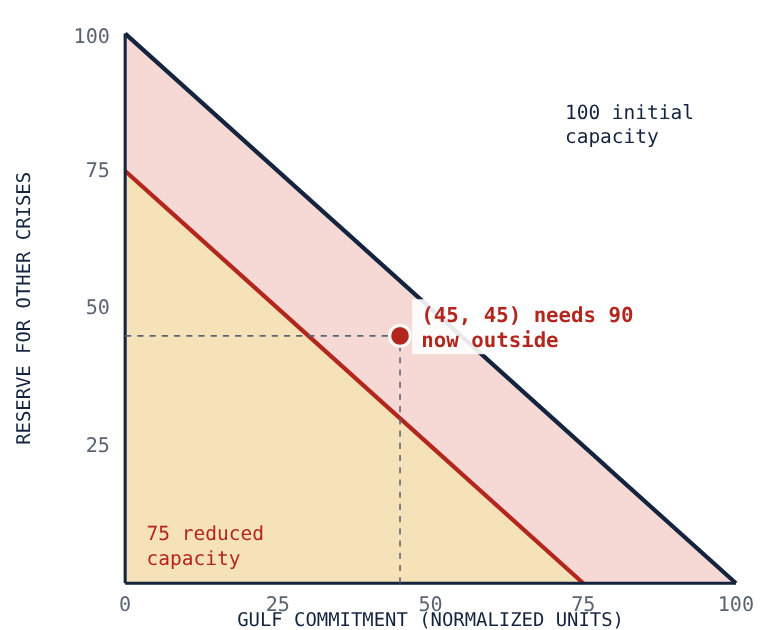
Supplied archive exhibit · original publication context.
Illustrative geometry. Power is a list of things you can still do, not one number. Money, ships, interceptors, transport and trained people do not swap for each other. Cut capacity from 100 to 75 units. Sending 45 to the Gulf and keeping 45 back needs 90. It no longer fits. The goals did not change; the trade-off got tighter. Teaching numbers, not a readiness estimate. [C1]
Two fractions, one fleet. Two carriers deployed, four available, eleven in the fleet. 2 / 4 = 50% of the available pool. 2 / 11 = 18.2% of the fleet. Same fact, two bottom numbers, two questions. Neither measures total fighting power. [I1; C1]
Why a small shortage can hold up a large force. A shared shortage delays a response, shrinks it, or makes it riskier. Or it pushes back another commitment. Two theatres that need different things can both go ahead. Choice is lost where needs overlap, not where money is spent. As the reserve shrinks, each spare unit is worth more. Its replacement price is visible. The option it keeps open is not.
05 / Inventory pressure
A stockpile is a promise with a running balance.
Four missiles, four bottom numbers, four different problems. Estimate dated 12 August 2026; not a September update. [I3; S6; C5]
Supplied archive exhibit · original publication context.
System | Fired | Reference stock | Share fired | Left on paper | Role |
|---|---|---|---|---|---|
PAC-3 MSE | 1,200 | 2,000 | 60.0% | 800 | Shoots down aircraft and missiles; biggest number fired. |
THAAD | 200 | 527 | 38.0% | 327 | Shoots down ballistic missiles high up. |
Tomahawk | 1,000 | 3,000 | 33.3% | 2,000 | Long-range strike missile; most left. |
PrSM | 100 | 112 | 89.3% | 12 | New long-range Army rocket; smallest stock, highest share fired. |
■ Bottom number. Is the reference stock all ever bought, the pre-war stock, or today's count? Deliveries, past use, tests and transfers change it.
■ Ready or not. A round on paper is not a round that is serviced, in place and assigned to the mission.
■ Dates. CBO counts interceptor use since June 2025. This estimate uses a different date and method. The two cannot be mixed into one number. [S1; S5]
There is no single depletion number for all four systems. A small new stock (PrSM) and a widely deployed defence system (PAC-3 MSE) are different problems. Lower reserves make it harder to answer two crises at once, even while this campaign stays affordable.
06 / The industrial clock
Years to refill. Each missile has its own clock.
Stock(t+1) = Stock(t) + Accepted deliveries − Expenditure − Net transfers − Retirements
620 Delivered in 2025 PAC-3 MSE, worldwide, maker's own figure; not all for the US. [S6] | 2,000 Yearly target Announced goal, not current output. [S6] | ≥5 years Full rebuild CBO view for interceptors; the 3–5-year order lag overlaps it and does not add. [S1] |
Illustration: 1,200-round gap | Net additions a year | Years after deliveries begin |
|---|---|---|
All 620 a year go to this stock; no further use | 620 | 1.94 |
Half go to this stock; no further use | 310 | 3.87 |
Half go to this stock; 100 a year fired | 210 | 5.71 |
310 a year in; 310 a year fired | 0 | No recovery |
C6. A what-if, not a forecast. Gap from the 12 Aug estimate; flow from 2025 world output. The allocation and use rates are made up for the sum. Assumes deliveries have started; rounds fired while waiting widen the gap, so the wait cannot be added on top.
The refill rule: deliveries accepted for the stock, minus everything that leaves it, must cover the gap. Track it by missile type and by buyer. Public data give no single finish date for Patriot, THAAD, SM-3, SM-6 and cruise missiles.
07 / The recovery clock
Figure 04 · Qualitative comparison
Four quantities that must stay separate
| Quantity | What it measures | What it cannot measure |
|---|---|---|
| Operating cost | Money required to sustain a defined posture | Strategic success |
| Reference inventory | A dated estimate of stock | Ready rounds at the required location |
| Accepted deliveries | Flow entering an identified stock | Future production targets |
| Mission-ready capacity | Hull, crew, support and mission alignment | Nominal fleet size alone |
The ship comes home. The capacity does not.
Delayed repairs, tired crews and missed training outlast the deployment. A ship counts only when hull, crew, support and mission line up.
Supplied archive exhibit · original publication context.
Count the stock | Count the flow | Count the recovery |
|---|---|---|
Ships and crews ready for missions. | Deployments extended and new repair work entering the queue. | Repairs finished, crews relieved, training back on schedule. |
A longer deployment pushes repair work into a yard that is already full. Recovery becomes a scheduling problem, not just a money problem. When dock slots, skilled workers and rested crews stop lining up, one delay spreads to every later commitment. The test: are finished repairs, crew relief and training keeping up with new demand? A lower daily cost cannot answer that. Public accounts of crew fatigue do not measure a fleet-wide fall in readiness.
08 / The route
A bypass only helps if the road beyond it is open.
Geography sets limits that spending alone cannot remove. Bypass figures are historical capacity, not confirmed September flows. [S4; C8]
20.9 mb/d Hormuz flow Oil through the Strait in the first half of 2025, million barrels a day; about one-fifth of world use. [S4] | 4.7 mb/d Bypass capacity, estimate Saudi Red Sea pipeline plus UAE Fujairah. Historical capacity, not today's flow; not additive. [S4] | 22.5% Size check 4.7 / 20.9. Not a forecast of what can be rerouted; not every cargo or exporter can switch. [C8] |
A pipeline removes one chokepoint. Terminals, onward ships and buyers' ports stay exposed. Routes that look separate on a map often share the same ports, insurers and guards. More than 100 ships stopped since July is a count of activity. Without the number of ships that sailed, the cargo displaced and a political result, it does not prove the blockade works. The real test: barrels delivered, on time, at what total cost. [I4]
09 / The fuel
America imports the price even when it skips the barrel.
The oil shock was still getting worse in August. Shut-ins are estimates; prices are monthly averages. [S3; S4; C8]
5.0 → 6.7 Crude shut in, mb/d Oil left unproduced because it cannot move or sell. July to August: +1.7 mb/d, +34%. [S3; C8] | $84 → $91 Brent, monthly average The world oil price benchmark. July to August: +$7 a barrel, +8.3%. [S3; C8] | 207.7m bbl August shut-in volume 6.7 × 31 days. A volume, not lost exports or a dollar loss; stocks and other suppliers cover part of it. [C8] |
The US brings in about 0.4 mb/d through Hormuz, about 2% of what it uses. The route carries about one-fifth of world use. Small direct exposure, full price exposure. Exporters earn more; importers pay more. Freight, insurance, stockholding and financing carry the shock beyond oil. [S4]
Transparent sensitivity | Arithmetic | Meaning |
|---|---|---|
An importer buys 1m barrels a day; the price is $10 higher for a year | 1m × $10 × 365 = $3.65bn | Extra import bill, before buyers cut back or hedge. |
$100m of extra stock held; 8% a year to finance it; 90 days | $100m × 8% × 90/365 = $1.97m | The financing cost only; assumptions, not observed losses. |
EIA data released 9 Sep; model cutoff 3 Sep. CBO expects inflation in early 2027 (PCE, the Fed's preferred gauge) to run 0.5 points above its February view, and core inflation 0.3 points above. Forecast changes, not September readings. [S1; S3]
The blockade raises fuel prices. The fleet enforcing it buys fuel too.
10 / One more year, priced
The spending stops before the costs do.
Kept apart from the naval model and from economic damage. Straight extensions of CBO's $2bn and $3bn monthly assumptions, 30-day model months. [S1; C9; C10]
Illustrative extension | Low path$2bn a month | July-like path$3bn a month |
|---|---|---|
30 days / 1 model month | $2bn | $3bn |
90 days / 3 model months | $6bn | $9bn |
180 days / 6 model months | $12bn | $18bn |
12 months | $24bn | $36bn |
First-year interest: new debt averages half the year-end total; 4% assumed | $0.48bn | $0.72bn |
Second-year interest: the full amount still owed; 4%; nothing repaid | $0.96bn | $1.44bn |
Extra future cost from a chosen start date. Not a spending estimate, not a range, not the full cost of escalation. Full borrowing, even spending and a 4% rate are assumed only to show the sum; the two interest rows are different years.
Tied-up capital. A $1bn-a-month goods flow that needs 15 extra days of stock ties up $0.5bn (30-day month). At 8% a year that costs $40m a year. The stock is still an asset; the financing charge is the cost. [C10]
Three cost channels. Repair: maintenance, restocking and care. Interest: owed while the debt stands. Trade: longer routes, bigger stocks, uncertain delivery dates. US enforcement, Iranian attacks and general insecurity all feed the last one; no single actor owns it. Do not count replacement spending twice: it is already in the military estimate. [S3]
These are what-ifs, not one world damage number. Some producers gain. Substitution helps. Inflation lifts revenue as well as spending. CBO finds the net effect on US output unclear, and its indirect budget effects roughly cancel out before extra war funding. [S1]
11 / The questions to ask
Measure what is left.
Question | Evidence to ask for | Reassess when |
|---|---|---|
Is the usable stock growing? | Deliveries accepted, rounds used, transfers out and retirements, for the same missile and the same period. | Net additions stay at or below zero. |
Is the force recovering? | Repairs completed, deployments extended, crews relieved, training delivered. | Recovery slips past the approved schedule. |
Do the promises add up? | US and allied allocation plans set against real delivery slots. | Several promises rest on the same undelivered missiles. |
Is trade reliable? | Barrels delivered, transit times, freight and insurance rates, stock levels. | Activity rises but trade does not improve for long. |
Is the political return there? | Stated aims, terms agreed, compliance, and a posture that can last. | The case for staying rests mainly on money already spent. |
These numbers do not show defeat, bankruptcy or a collapse in readiness. They show that two crises at once would be hard. That is the whole finding.
The question is not "How much have we spent?" It is "What is left?"
The arithmetic / C1 – C10
The sums are simple. The definitions do the work.
Calculation | Formula and result | Interpretation limit |
|---|---|---|
C1 Denominators | 2/4 = 50%; 2/11 = 18.2%; capacity 100 → 75; (45,45) = 90 > 75 | Pool share vs fleet share; teaching geometry only. |
C2 Series | (1,575−583)/31 = 32.00; (42−32)/2,009 = 0.50%; 2,009/64 = 31.39; 2,009/63 = 31.89 | Month-end differencing; the endpoint is a convention. |
C3 Phases | 652+1,100+126+2,400+825+2,000 = 7,103; 5,351/7,103 = 75.3%; (126+825)/(5+25) = 31.7/day | Rounded labels summed; naval model only; inclusive days. |
C4 Composition | 21.7/38.1 = 57.0%; 13.1/38.1 = 34.4% | Shares of estimated cost, not of capability lost. |
C5 Inventory | 1,200/2,000 = 60.0%; 200/527 = 38.0%; 1,000/3,000 = 33.3%; 100/112 = 89.3%; residuals 800, 327, 2,000, 12 | Four separate systems; residuals are not usable inventories. |
C6 Rebuild | years = gap / (allocated deliveries − use − other outflows); 1,200/620 = 1.94; /310 = 3.87; /210 = 5.71 | Constant-flow case; net deliveries must close the gap, including changes during any wait. |
C7 Congestion | 1/(1−u): u = 0.5 → 2.00; 0.7 → 3.33; 0.8 → 5.00; 0.9 → 10.00 | Textbook time-in-system multiplier; no calibration to naval yards. |
C8 Energy | 6.7/5.0−1 = 34%; 6.7×31 = 207.7m bbl; 91/84−1 = 8.3%; 4.7/20.9 = 22.5% | Estimates and monthly averages; bypass is capacity, not substitution. |
C9–C10 Extension | monthly rate × model months: 2 × 3 = 6bn; 12 × (2 or 3) = 24 or 36bn; yr-1 interest = P × 0.5 × 4%; yr-2 = P × 4%; 1bn × 15/30 × 8% = 40m/yr | Conditional increments, not expenditure; hypothetical rate; inventory carry is a financing charge, not a loss. |
SOURCES / THE EVIDENCE TRAIL
S1 Congressional Budget Office, Estimating the Cost of Combat Operations Against Iran, 15 Sep 2026.
S2 Wire reporting, 18 Sep 2026: CENTCOM estimate of $43.6bn through 3 Sep; original not public.
S3 US EIA, Short-Term Energy Outlook, 9 Sep 2026; model cutoff 3 Sep.
S4 US EIA, World Oil Transit Chokepoints, updated 3 Mar 2026. Hormuz baseline, destination exposure, bypass capacity.
S5 Independent munitions-status assessment, Last Rounds? Status of Key Munitions at the Iran War Ceasefire, Apr 2026. Differs in date and definition from I3.
S6 Lockheed Martin, PAC-3 MSE production framework, 6 Jan 2026: 620 global deliveries in 2025; 2,000-a-year target.
V1 Naval deployment cost series, animated model, 14 Jul to 15 Sep. Duplicate frames removed; checkpoints cross-checked against stills.
I1–I4 Public infographics: fleet availability (I1); cost phases and rotation peak (I2); inventory estimate dated 12 Aug (I3); ships intercepted since July (I4).
C1–C10 Our own calculations, shown beside their results. Exhibit 4 is an explanatory model. Public material reviewed 22 Sep 2026.