Original Lens and publication context
The report models token volume at 24x by 2030. Compute cost is falling faster than token price. The agentic economy is no longer just a demand story — it is a margin story. Capex sustainability inflects in the next three to twelve months.
- The model projects token volume at 24x by 2030: from roughly five quadrillion tokens a month today to one hundred and twenty quadrillion. Consumer agents alone add sixty quadrillion a month; enterprise, at thirty-seven percent peak knowledge-worker adoption, reaches 278 quadrillion — over seventy percent of total compute demand.
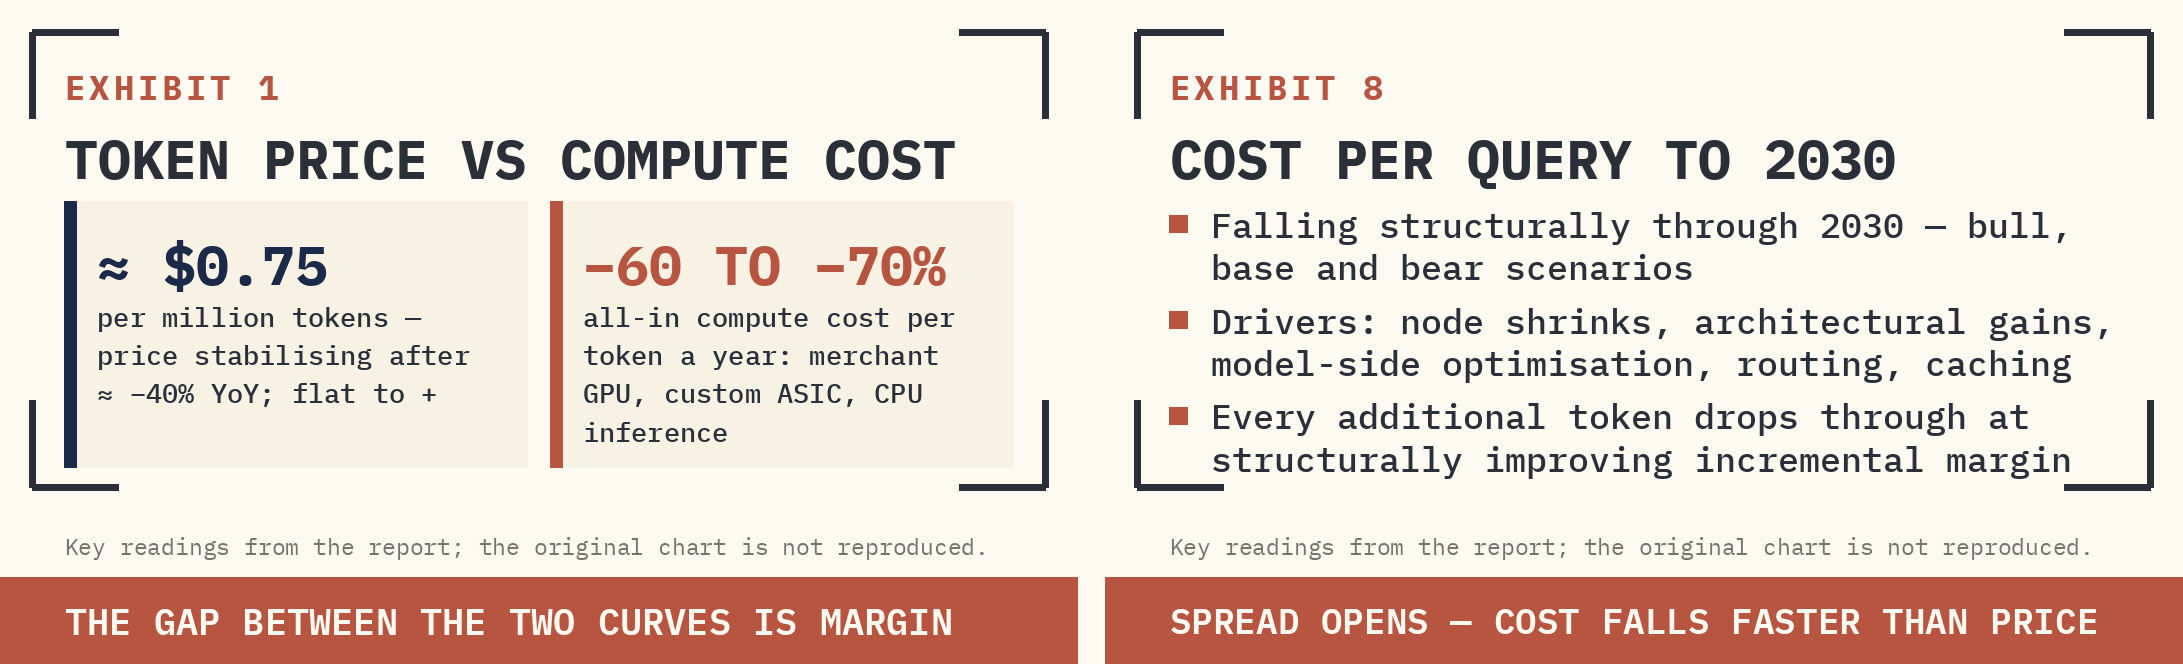
- Compute cost per token is falling sixty to seventy percent a year across the leading silicon stacks, while token prices — after years of roughly forty-percent annual deflation — are flat to rising for leading model providers. The gap between the two curves is margin.
- The agentic cycle prices compute as margin, not cost: gross margins at hyperscalers and leading model providers inflect in the next three to twelve months, and capex could become more sustainable if incremental cash margins cover investment; volume growth alone does not establish that.
- Where it breaks: modality (coding agents at thirteen dollars a day are an order of magnitude below human cost; call-centre agents at ninety-three dollars sit at parity), institutional friction (70–90% of enterprises trial agents, under 25% scale them), and a fifteen-year S-curve, not a J-curve.
- Position: silicon first, hyperscale second, software and IT services third. India is the highest-stakes market — long enterprise integration and AI orchestration, cautious on the cost-arbitrage staff-augmentation core: a long-orchestration, short-arbitrage pair priced as if the second leg does not exist.
I. TRIGGER
A new bottom-up framework, modelled on simulated agents priced step-by-step against current chip economics, has done what eighteen months of top-down narrative could not. It has put numbers on the agentic phase of the AI cycle. The conclusion is sharper than the chatbot debate: the marginal economics of inference are now turning, and they are turning at the same moment the volume curve breaks higher.
Three curves are moving simultaneously. Token volume, on a path to twenty-four times current global throughput by 2030. Compute cost per token, declining sixty to seventy percent annualised across the leading silicon stacks. Token price, after years of forty-percent annual deflation, now flat to rising for leading model providers. When the cost curve falls faster than the price curve, the gap is margin.
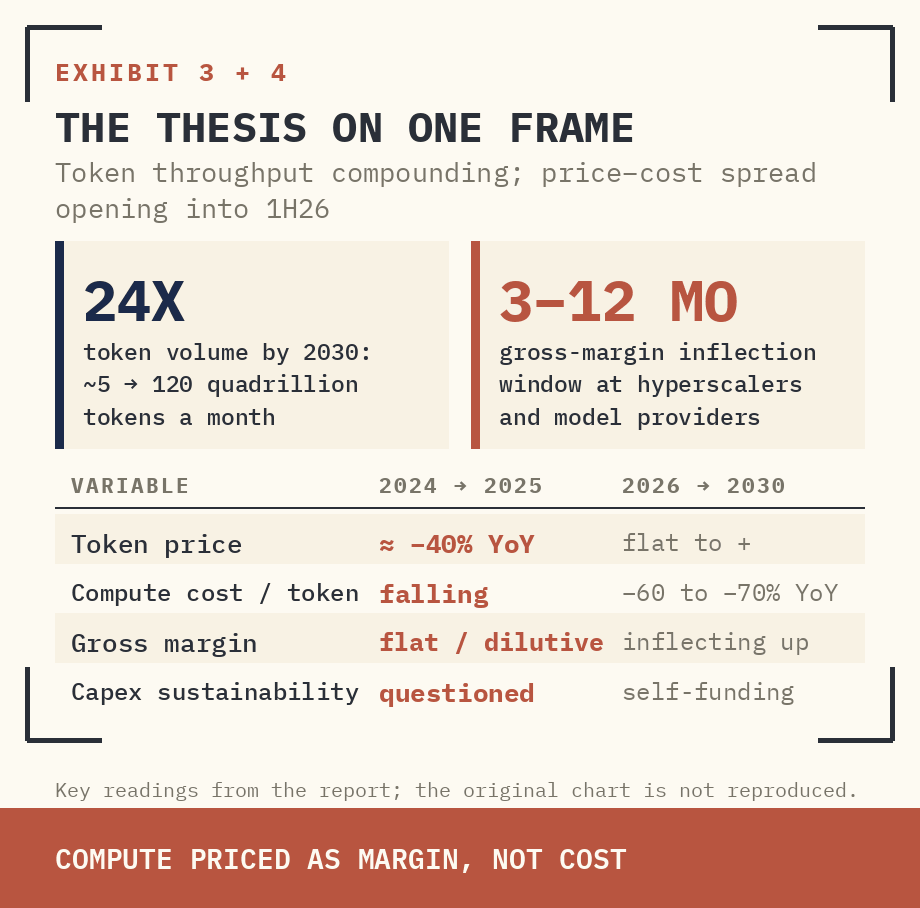
Supplied archive exhibit · original labels. Read alongside the editorial corrections.
Consensus still treats agents as a demand story riding a deflationary cost line. The stronger reading is that the same forces compounding token volume — persistent execution, multimodal context, multi-step validation loops — are also the forces that pull cost-per-task down a curve steep enough to drag previously uneconomic workflows into positive ROI. Self-reinforcing flywheel, not a consumption line.
The first AI cycle priced compute as a cost. The agentic cycle prices it as margin. That is the entire trade.
II. FLOW
THE VOLUME STEP-FUNCTION
The original May research model estimates global LLM throughput at roughly five quadrillion tokens per month. A bottom-up build, occupation by occupation and use case by use case, pushes that figure to one hundred and twenty quadrillion tokens per month by 2030. Twenty-four times. The split between consumer and enterprise matters more than the headline.
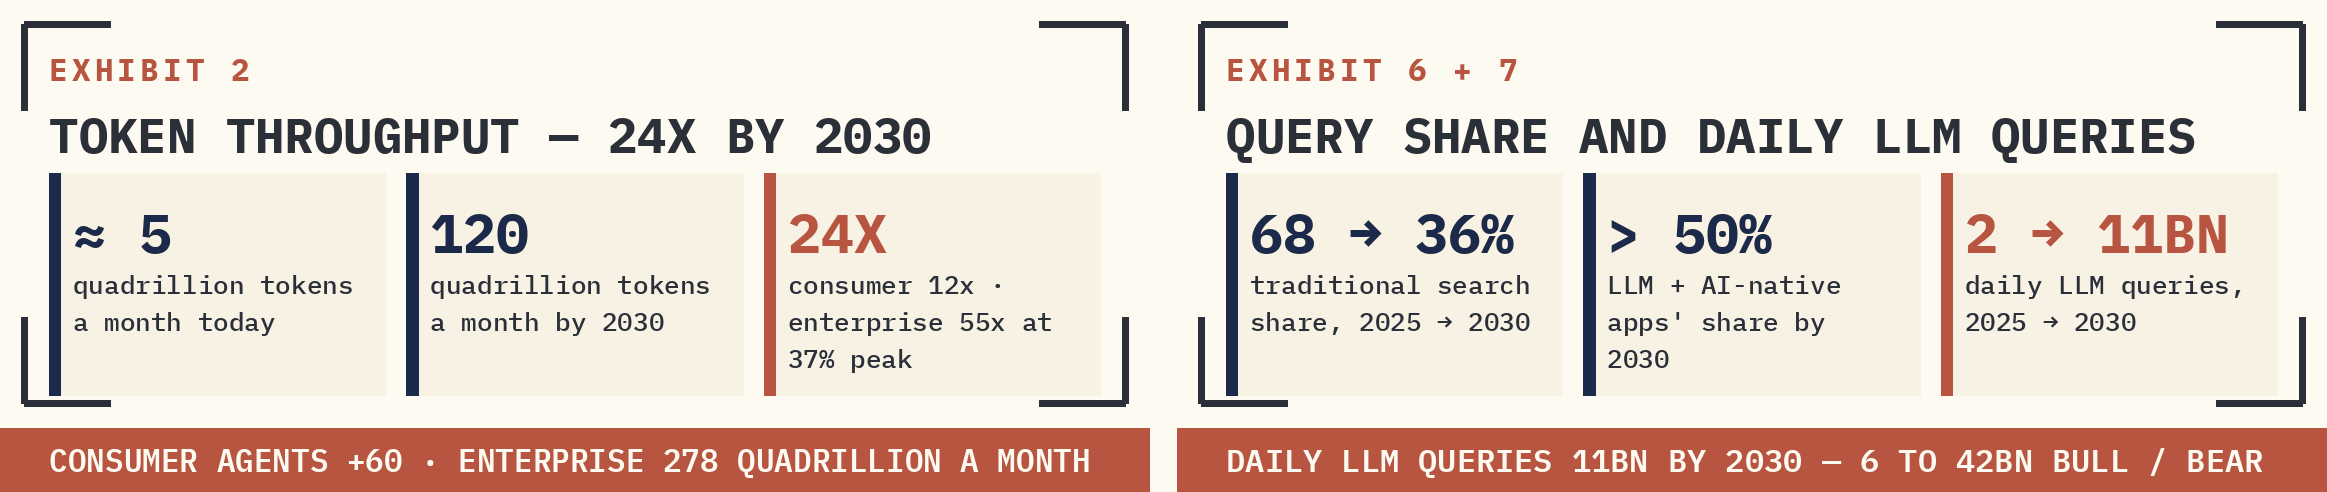
Supplied archive exhibit · original labels. Read alongside the editorial corrections.
A. CONSUMER — FROM EPISODIC CHAT TO ALWAYS-ON
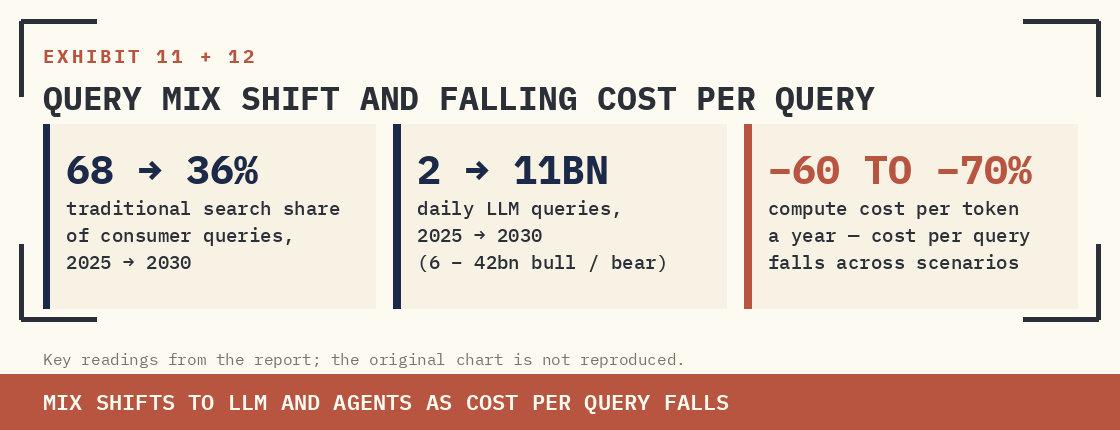
Consumer AI today is dominated by traditional search; LLM and AI-native apps take growing share. Base case: LLM and native AI apps over half of total query volume by 2030, traditional search compressed from sixty-eight to thirty-six percent. Daily LLM queries scale from two billion in 2025 to eleven billion in 2030 (six to forty-two billion bull/bear). The volume multiplier, however, is not more chatbot sessions — it is the shift in usage patterns. Today's consumer AI is episodic. The agentic phase changes this: agents plan, execute, monitor, and act on the user's behalf. At thirty percent of consumer queries directed to agents by 2030, the consumer leg alone adds sixty quadrillion tokens per month — twelve times current global throughput. Two distinct models emerge — on-demand agents (browser, coding) execute discrete user tasks; always-on agents (email monitors, life assistants, schedule managers) run persistently in the background. The latter is where the real volume sits.
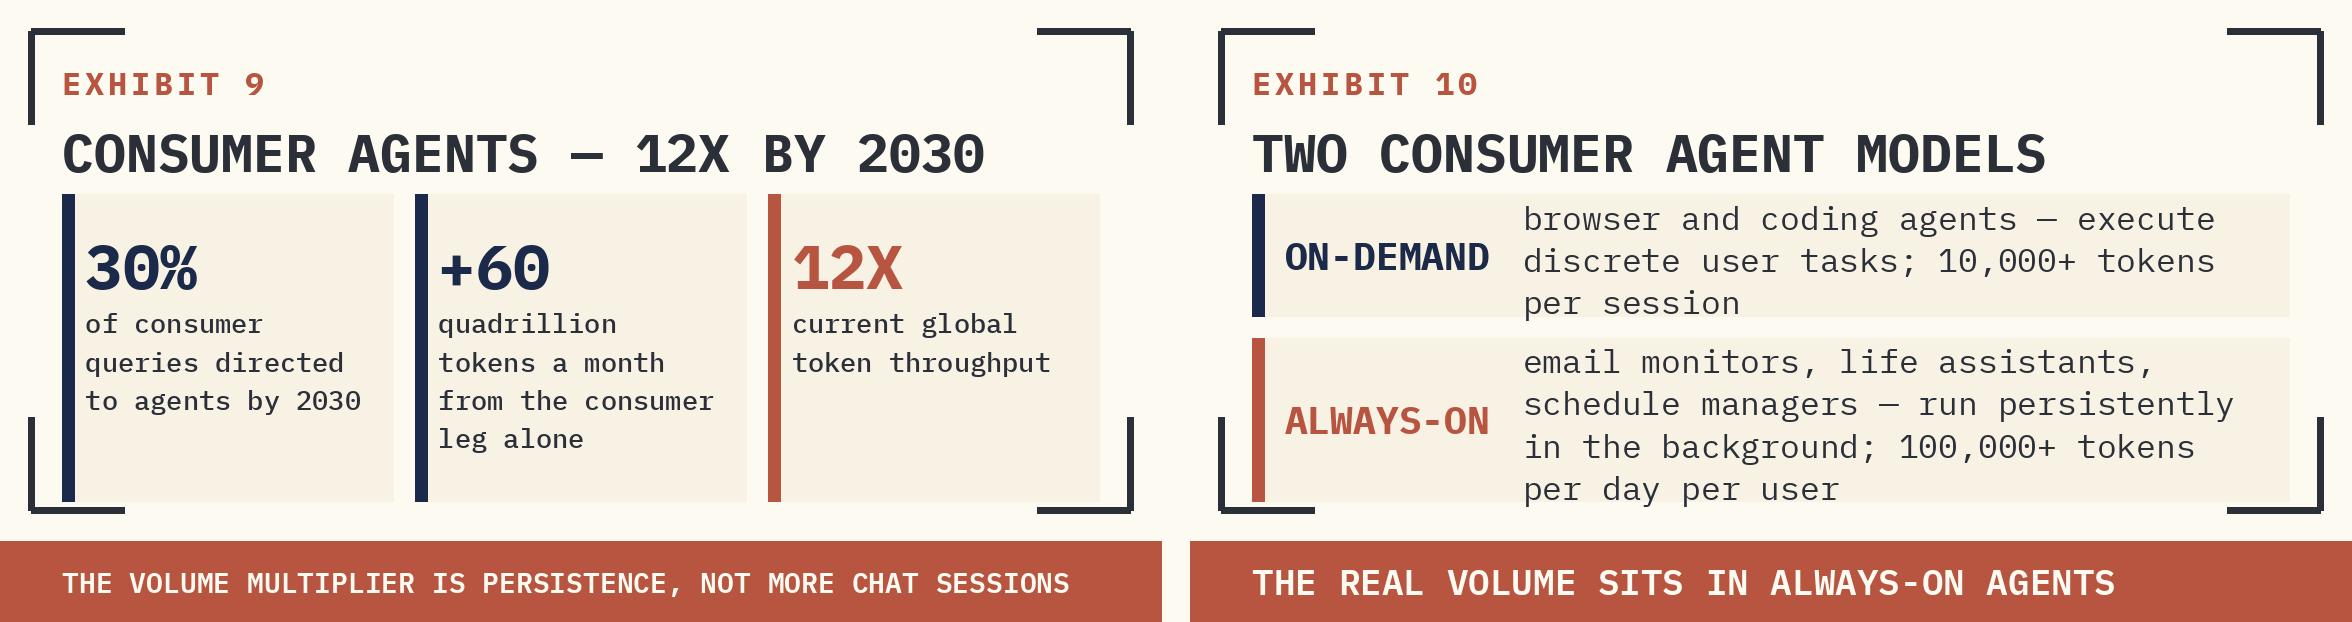
Supplied archive exhibit · original labels. Read alongside the editorial corrections.
The token-intensity hierarchy is unambiguous. LLM chatbots burn about a thousand tokens per session. Embedded copilots — AI in search, email, productivity apps — burn over five thousand per day per user. On-demand agents in the ten-thousand-plus range per session. Always-on agents are the highest-intensity workload by a wide margin: over one hundred thousand tokens per day per user, continuously, with minimal user engagement.
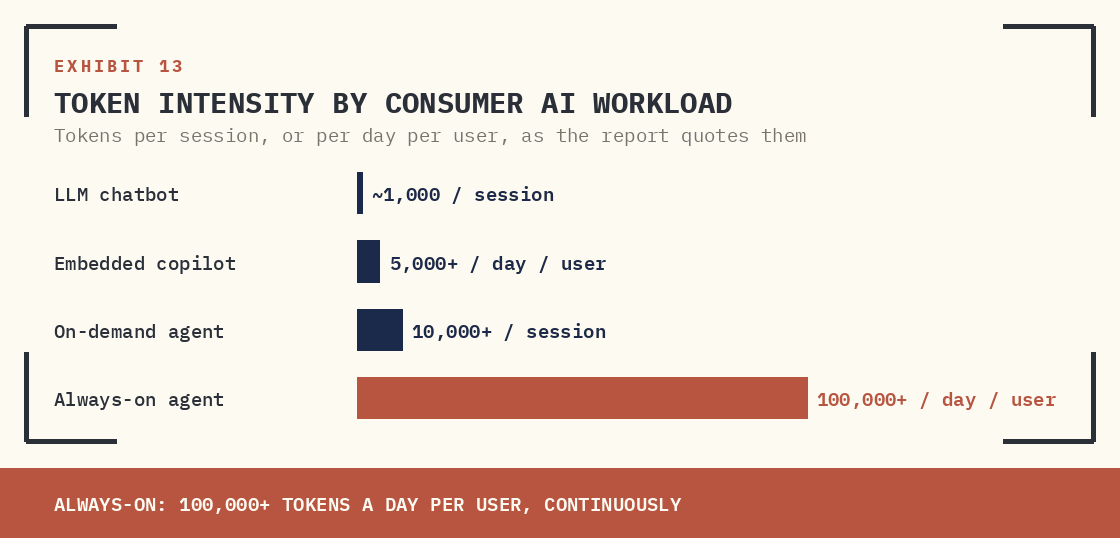
Supplied archive exhibit · original labels. Read alongside the editorial corrections.
B. ENTERPRISE — THE LARGER, SLOWER-BURNING LEG
Enterprise is the bigger story and the slower one. Surveys put seventy to ninety percent of enterprises experimenting with AI agents; fewer than a quarter are scaling them. The next phase is the steepening middle of an S-curve, not a J-curve. At the model’s thirty-seven percent peak knowledge-worker adoption, on its longer horizon to 2040, enterprise workloads alone reach two hundred and seventy-eight quadrillion tokens per month, accounting for over seventy percent of total compute demand. Twelve percent adoption by 2030 is the modelled mid-path.
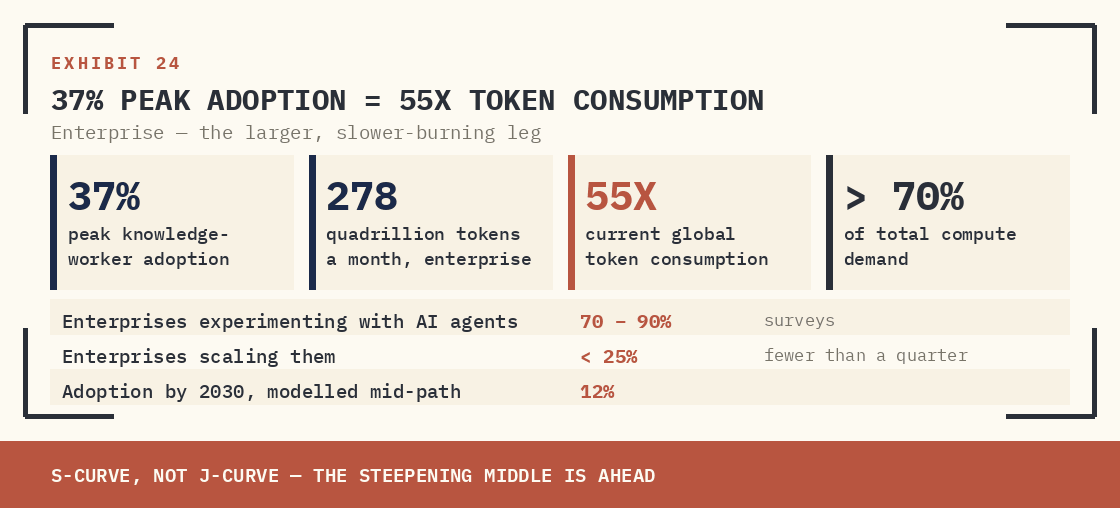
Supplied archive exhibit · original labels. Read alongside the editorial corrections.
Enterprise adoption hits the AI-exposed occupations first. The exposure ranking — derived from observed agent usage patterns rather than theoretical automation potential — places computer programmers at the top with seventy-five percent task exposure, followed by customer service representatives, data entry keyers, medical record specialists, and market research analysts. The headcount weighting of these roles is what makes the enterprise leg structurally larger than consumer despite reaching scaled adoption later.
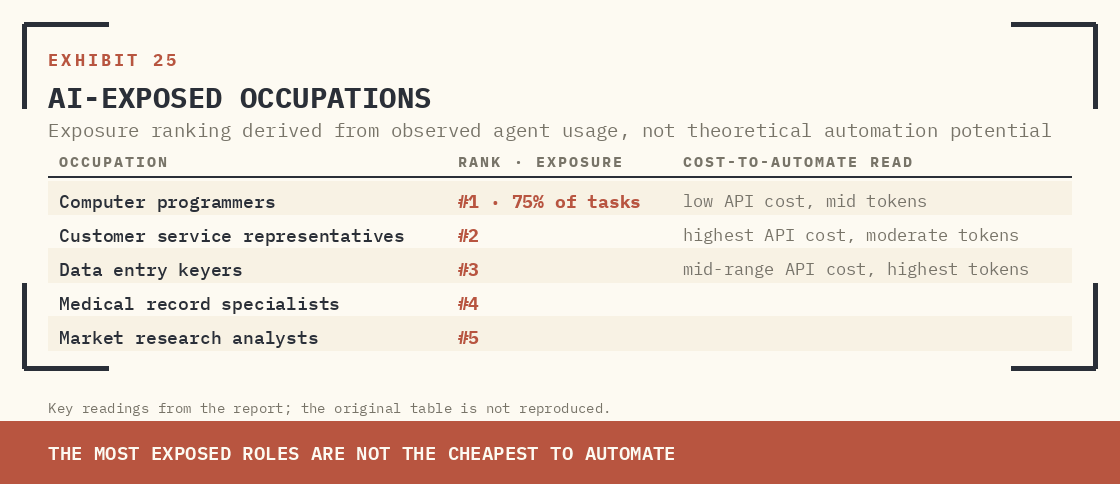
Supplied archive exhibit · original labels. Read alongside the editorial corrections.
C. ARCHITECTURE — WHY AGENTS BURN TOKENS
The simulated-agent build resolves a long-running argument about why enterprise agents consume orders of magnitude more tokens than chatbots. The answer is loop structure. An autonomous agent is not a single model call. It ingests context, retrieves information, executes the task, checks its work, resolves errors, updates systems. Different steps require different model capabilities — lower-cost models classify and extract, stronger reasoning models plan and reconcile, code models write and test, vision models parse documents and screens.
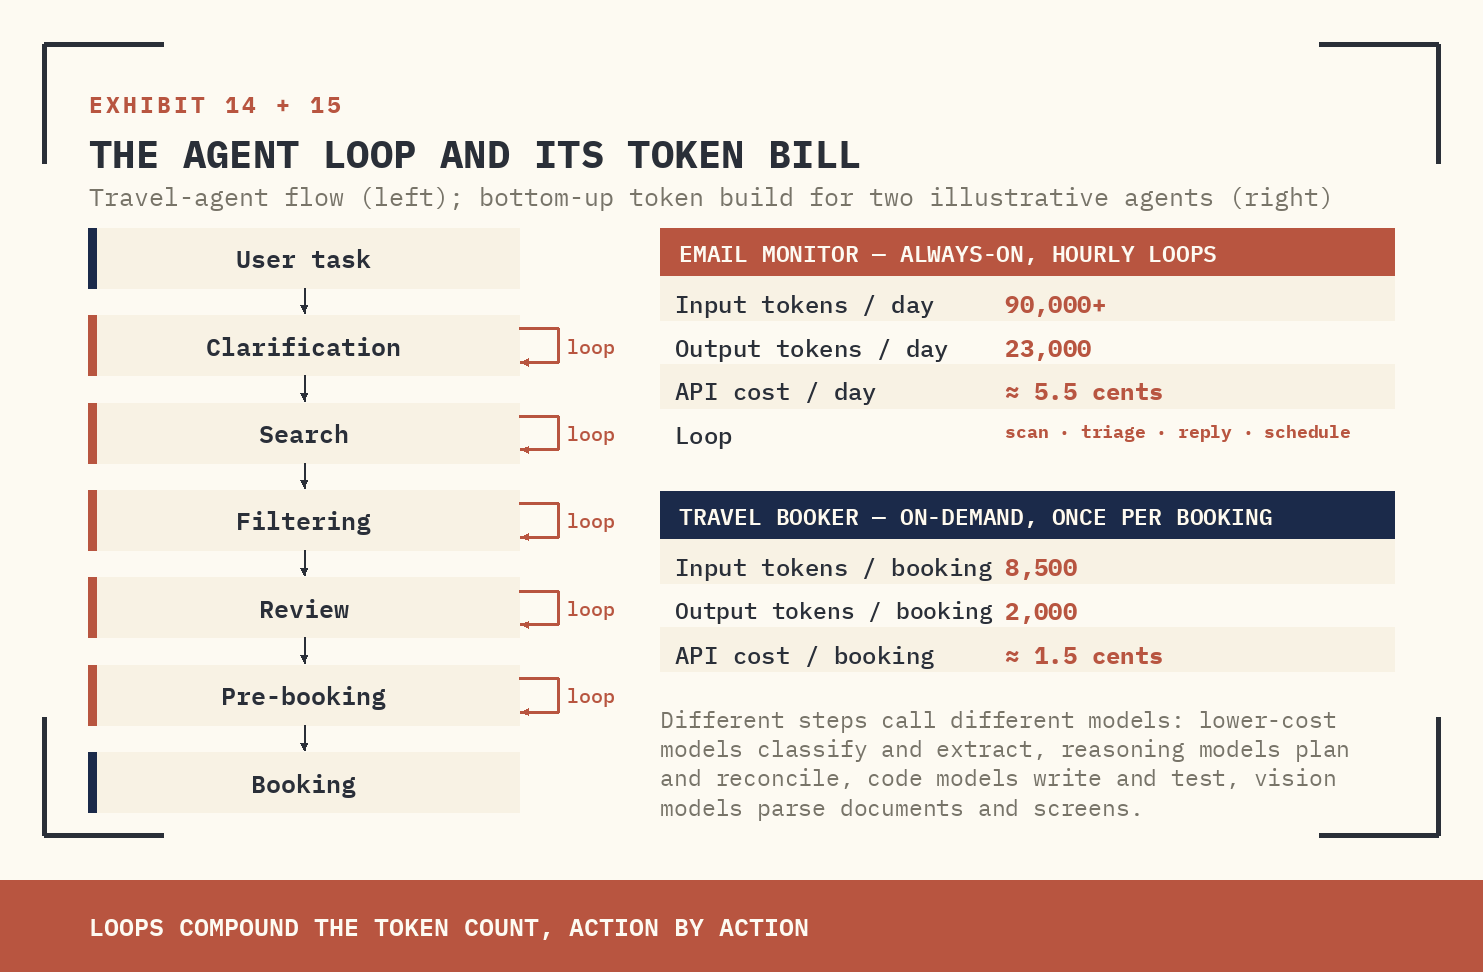
Supplied archive exhibit · original labels. Read alongside the editorial corrections.
The bottom-up token build for two illustrative agents quantifies the cost. The email monitor runs hourly scan, triage, reply, and scheduling loops — over ninety thousand input tokens and twenty-three thousand output per day, roughly five and a half cents in API cost. The travel agent, executing once per booking, runs a fraction of that volume — eighty-five hundred input, two thousand output, one and a half cents per booking.
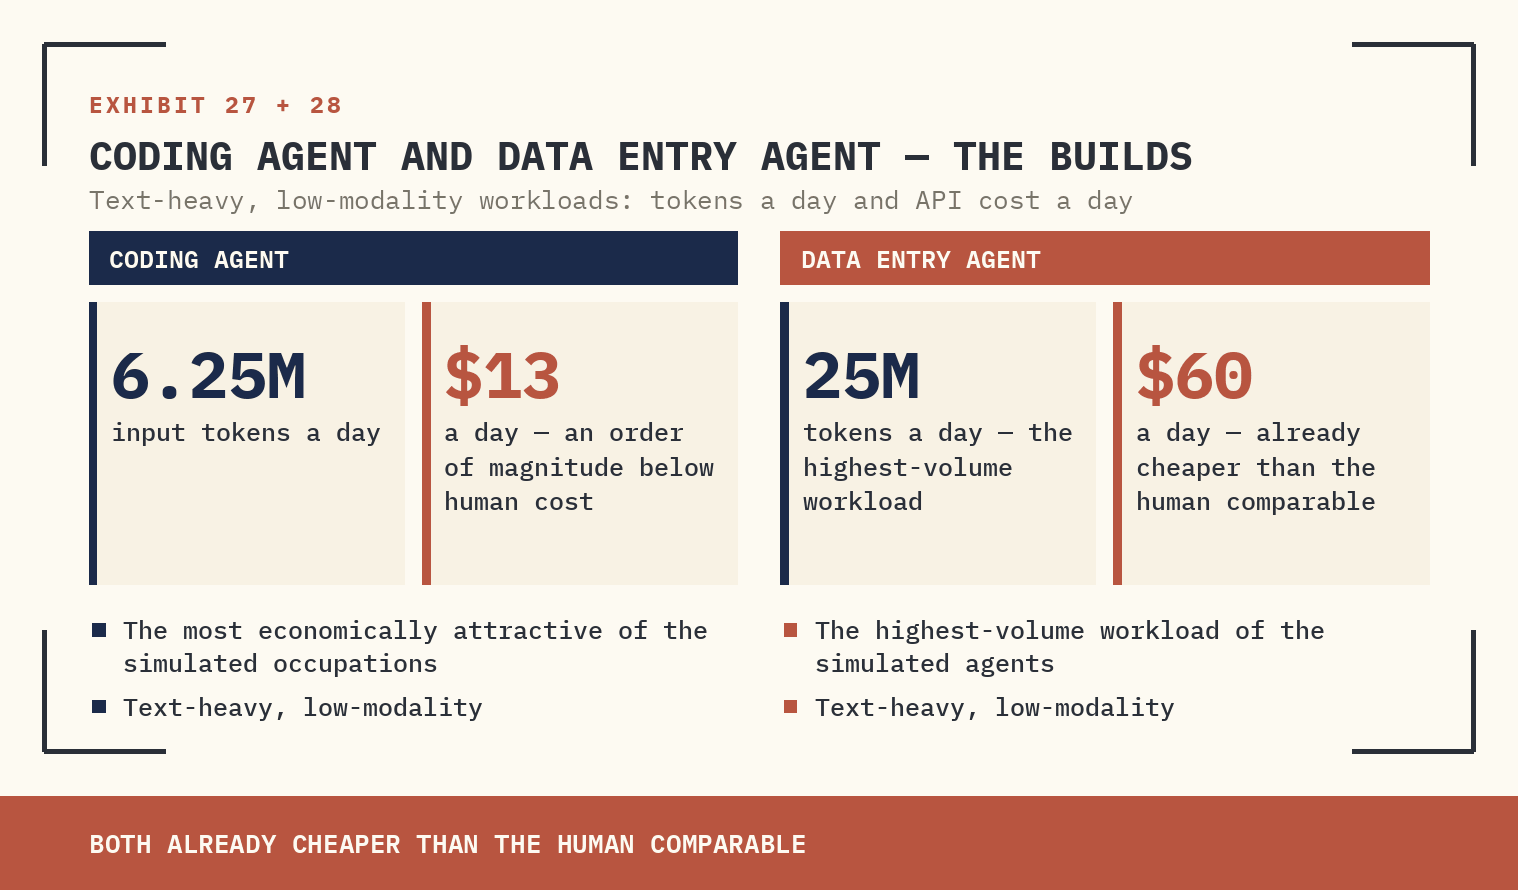
Supplied archive exhibit · original labels. Read alongside the editorial corrections.
The coding agent is the most economically attractive of the simulated occupations — six and a quarter million input tokens daily at thirteen dollars, an order of magnitude below human cost. The data entry agent is the highest-volume workload — twenty-five million tokens at sixty dollars. Read across to the enterprise: an always-on email monitor running for one knowledge worker is roughly the same architecture as a customer support copilot, an inventory monitor, a contract review agent, or a pipeline-watching SRE agent. Multiply by enterprise headcount and token volume compounds quickly. This is why the enterprise multiplier is fifty-five times by 2040 even though only thirty-seven percent of knowledge workers ever reach scaled adoption.
Loops drive the volume. Multimodality drives the cost. The two are decoupled — and that decoupling is what gates which workflows scale first.
III. PRICE
Figure 01 · Conceptual framework
Why an agent consumes more than one model call
WHERE THE MARGIN LIVES
This is the part of the cycle the consensus model does not yet price. Token prices for leading model providers, after years of roughly forty-percent annual deflation, have stabilised — and in some tiers are rising as providers reserve capacity for higher-margin agentic and reasoning workloads. At the same time, all-in compute cost per token across the leading silicon stacks — merchant GPUs, custom ASICs, and CPU-attached inference — is declining sixty to seventy percent annualised, driven by node shrinks, architectural gains, model-side optimisation, routing, and caching.
Supplied archive exhibit · original labels. Read alongside the editorial corrections.
The flywheel is mechanical. Lower compute cost per token enables richer agents with longer context, more loops, and more validation. Richer agents consume more tokens. Higher utilisation improves infrastructure economics. Better infrastructure economics fund continued model and capacity investment. The narrative that AI usage will simply pile cost on cost mistakes the shape of the curve.
Supplied archive exhibit · original labels. Read alongside the editorial corrections.
VARIABLE | 2024 → 2025 | 2026 → 2030 | IMPLICATION |
|---|---|---|---|
Token Price (leading models) | ≈ –40% YoY | Flat to + | Pricing power returning at the frontier |
All-in Compute Cost / Token | Falling | –60% to –70% YoY | Steepening cost curve |
Gross Margin Direction | Flat / dilutive | Inflecting up | Spread opens, drops through |
Capex Sustainability | Questioned | Conditional on cash returns | Volume × spread is not cash flow after all costs |
The risk is not that more usage destroys margin; the risk is that competition compresses the spread on commoditised text-only chatbots before the agentic mix matures. The hedge is differentiation on agentic and reasoning workloads, distribution, and verticalisation — not on raw inference.
IV. RISK
WHERE THE THESIS BREAKS
The framework is constructive but not flat. Four asymmetries can derail the inflection or stretch it beyond the modelled window. The first is modality. The second is institutional. The third is ROI visibility. The fourth is the shape of the adoption curve itself.
A. MODALITY — CODING CHEAP, VOICE EXPENSIVE
In the enterprise, agentic AI adoption depends less on token volume and more on the full API cost of replicating a user's workflow. The radial economics show a key tension: some agents consume very high token volumes but remain low cost if the workflow is mostly text-based. Others consume fewer tokens but carry much higher API cost because they require real-time voice, latency tolerance, and multi-modal processing.

Supplied archive exhibit · original labels. Read alongside the editorial corrections.
Coding agents burn roughly seven million tokens per day at thirteen dollars — already an order of magnitude below the human comparable. Data entry agents burn twenty-five million tokens at fifty-nine dollars, also already cheaper than humans. Call-centre agents burn just two million tokens but cost ninety-three dollars because real-time voice inflates per-token economics, sitting roughly at parity with human labour. Data entry keyers have the highest token intensity but mid-range API cost. Customer service representatives have moderate token intensity but the highest API cost. Computer programmers, the most exposed occupation by task share, sit in low-cost, mid-token territory. The mismatch between exposure and cost-to-automate is the structural reason adoption sequences will not follow the headline exposure ranking.
The most exposed roles are not the cheapest to automate. The cheapest to automate scale first. The expensive ones wait for the cost curve.
B. INSTITUTIONAL FRICTION
Foundation models, tool-calling, and memory architectures are no longer the bottleneck. Data governance, deterministic controls, auditability, change management, and the question of who owns the outcome of an autonomous action are. Enterprises with diffuse accountability stall the longest. The rapid trial figures (seventy to ninety percent) collapse to under twenty-five percent at the scaling stage for a reason. ROI visibility is uneven — productivity gains are real but soft to budget against. Hard cost take-out shows up only when agents replace headcount line-items, which most enterprises will not commit to until governance frameworks mature.
C. ADOPTION CURVE — SHAPE, SPEED, AND PEAK
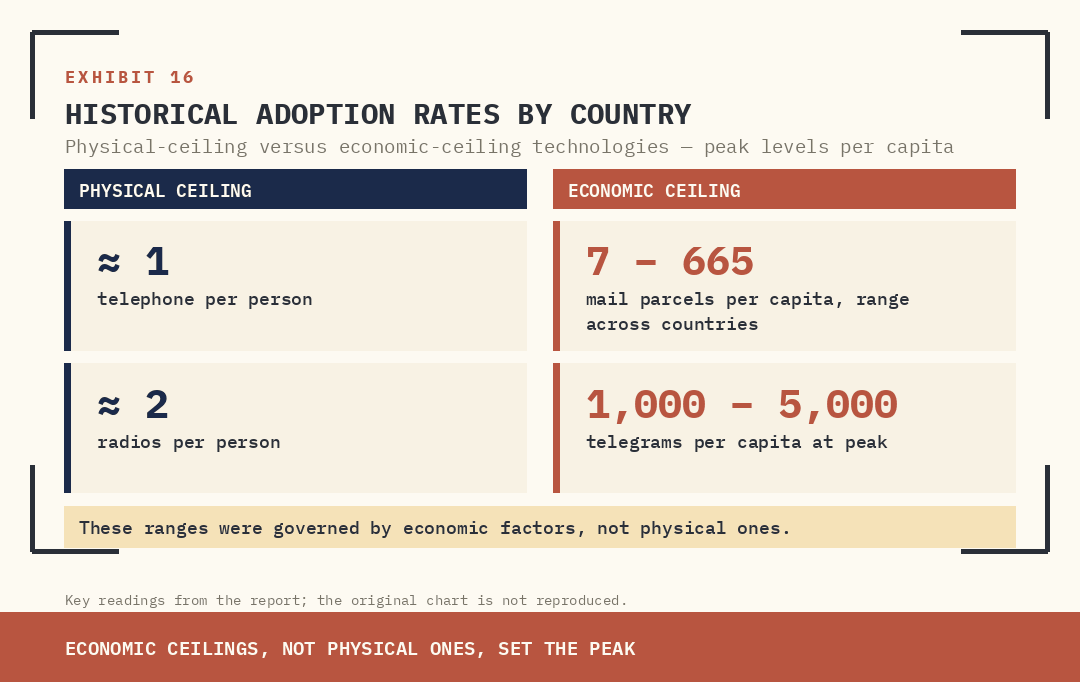
The historical record on technology diffusion is the most underappreciated input to the modelling. Some technologies hit physical ceilings — telephones at roughly one per person, radios at two. Others have no obvious cap. Mail parcels per capita varied between seven and six hundred and sixty-five across countries. Telegrams varied from one thousand to five thousand per capita at peak. These ranges were governed by economic factors, not physical ones.
Supplied archive exhibit · original labels. Read alongside the editorial corrections.
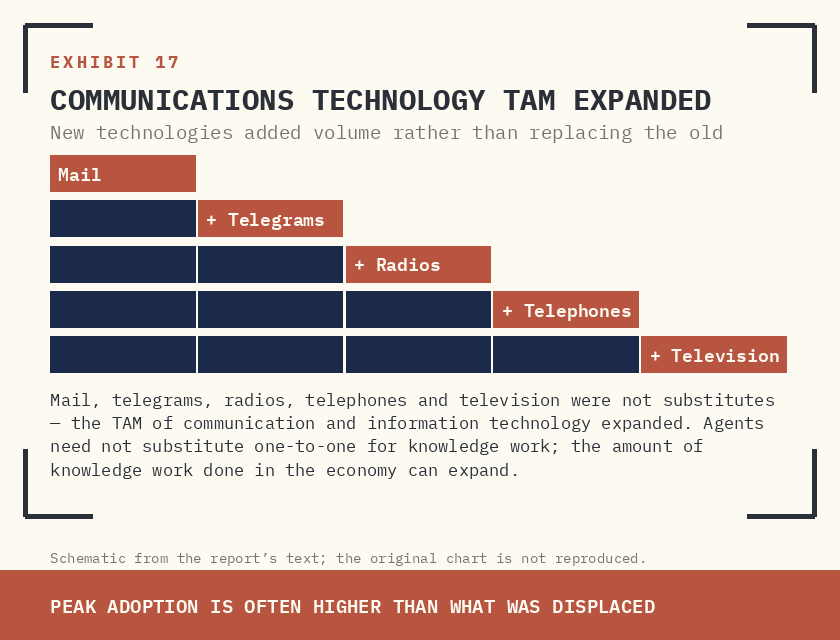
More importantly, peak adoption of new technologies is often higher than what was displaced — because new technologies do not necessarily replace existing ones. The various forms of communication technology — mail, telegrams, radios, telephones, television — were not substitutes. The TAM of communication and information technology expanded. Apply this to agents: agents do not need to substitute one-to-one for human knowledge work. The amount of knowledge work done in the economy can expand. A call-centre agent serving previously unmet demand at zero wait time is incremental, not displacing.
Supplied archive exhibit · original labels. Read alongside the editorial corrections.
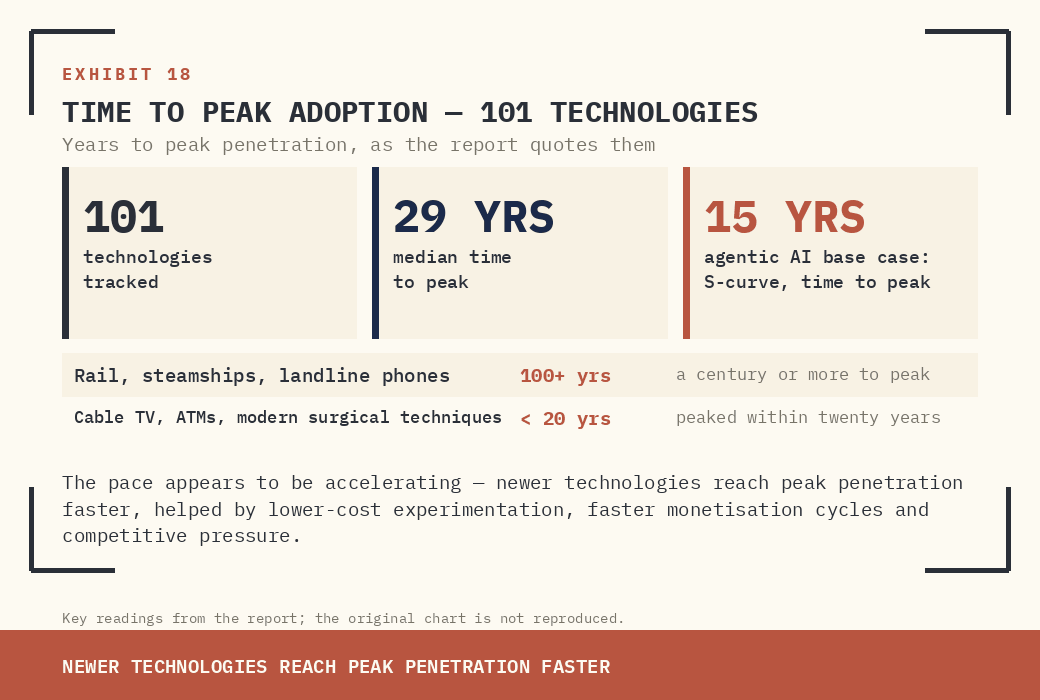
Speed of adoption varies even more widely. Rail, steamships, and landline phones took a century or more to peak. Cable TV, ATMs, and modern surgical techniques peaked within twenty years. The median technology took twenty-nine years. The pace appears to be accelerating — newer technologies are reaching peak penetration faster than older ones, helped by lower-cost experimentation, faster monetisation cycles, and competitive pressure on enterprises to keep pace.
Supplied archive exhibit · original labels. Read alongside the editorial corrections.
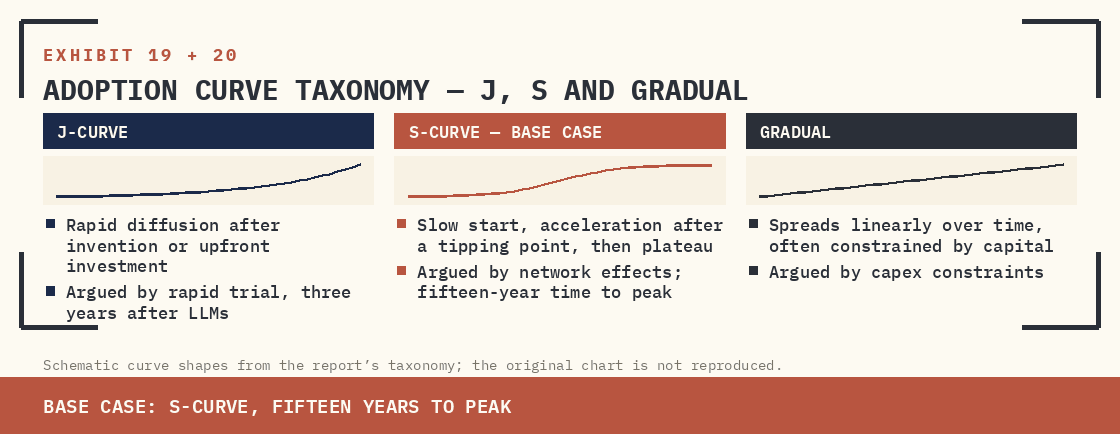
Adoption curves themselves take three principal shapes. J-curves diffuse rapidly after invention or an upfront investment phase. S-curves start slowly, accelerate after a tipping point, then plateau. Gradual curves spread linearly over time, often constrained by capital. Agentic AI shows characteristics of all three — capex constraints argue linear; network effects argue S-curve; rapid trial just three years after the popularisation of LLMs argues J-curve. The base case lands on S-curve with a fifteen-year time-to-peak.
Supplied archive exhibit · original labels. Read alongside the editorial corrections.
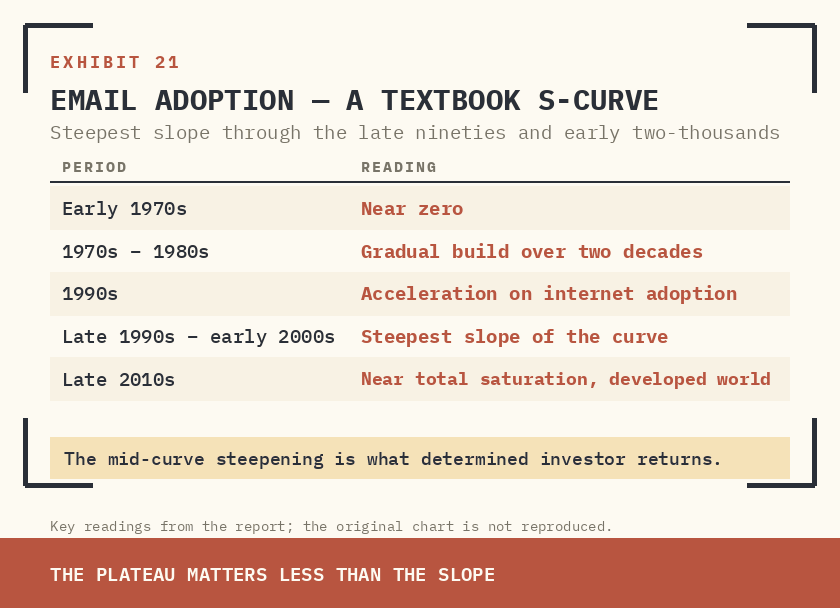
Email is the cleanest analogue — a clear S-curve. From near-zero in the early nineteen-seventies, email built gradually for two decades, accelerated through the nineties on the back of internet adoption, and levelled out near total saturation in the developed world by the late twenty-tens. The mid-curve steepening is what determined investor returns. The plateau matters less than the slope.
Supplied archive exhibit · original labels. Read alongside the editorial corrections.
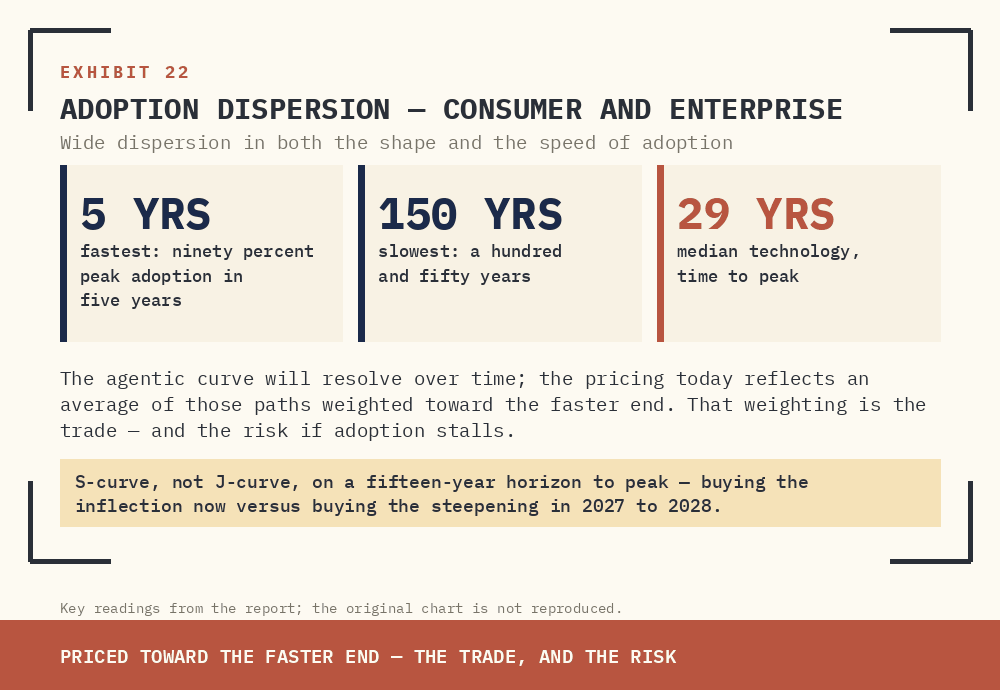
The composite picture is messy. Consumer technologies and enterprise technologies show wide dispersion in both shape and speed. Some hit ninety percent peak adoption in five years; others take a hundred and fifty. The agentic curve will resolve over time; the pricing today reflects an average of those paths weighted toward the faster end. That weighting is the trade — and the risk if adoption stalls.
Supplied archive exhibit · original labels. Read alongside the editorial corrections.
None of these break the long curve. They shape its slope. S-curve, not J-curve, on a fifteen-year horizon to peak. That distinction is the difference between buying the inflection now and buying the steepening in 2027 to 2028.
V. POSITION
Figure 02 · Qualitative comparison
Where the margin thesis must be tested
| Layer | Potential advantage | Proof needed |
|---|---|---|
| Silicon | Lower cost per unit of useful compute | Real utilisation and performance per watt |
| Platforms | Distribution and shared infrastructure | Serving margin after all operating costs |
| Orchestration | Workflow ownership and integration | Repeatable outcomes with controlled review costs |
THE BOOK
The position framework runs across three buckets aligned to where the spread shows up first: silicon (cost curve), distribution (consumer and enterprise utility), and orchestration (workflow capture). Conviction tiers reflect proximity to the margin inflection rather than narrative leverage.
BUCKET | GROUP | THESIS |
|---|---|---|
Semiconductors | Custom-silicon, merchant-GPU and CPU-attached inference vendors | Falling cost per token expands TAM faster than ASPs decline. Custom silicon (ASIC) leadership; merchant GPU breadth; CPU-attached inference and emerging GPU share. |
Internet / Hyperscale | The hyperscalers and consumer internet platforms | Distribution and full-stack utility. Cloud backlog visibility and in-house silicon pull-through; cloud and search multi-modality; AI-driven ad engagement capture. |
Software / IT Services | Enterprise software, edge-network and IT-services names | Outcome and unit-of-work pricing expands TAM as token cost falls. Productivity-copilot ecosystems; edge inference; enterprise integration and orchestration. |
Sequencing matters. The silicon book leads on the cost-curve narrative. Internet and hyperscale follow as the inflection works through gross margins and capex defensibility. Software and IT services capture the longer-tailed enterprise adoption curve, where units-of-work pricing converts agent workloads into recurring revenue and where integration and governance demand becomes structural.
VI. INDIA READ-ACROSS
India is the highest-stakes equity market under this framework, for one reason: services exports. The Indian IT services complex was built on a cost-arbitrage labour model — selling human knowledge work, billed by the hour, to North American enterprises. The agentic phase of AI is the most direct frontal assault on that revenue line in twenty years. Read-across is sharper than the consensus take that AI is a productivity tailwind for Indian IT.
- Indian IT services — structural pressure on the staff-augmentation model. North America revenue mix runs sixty percent and above for the top names. The bear case is not that agents replace these firms; it is that the core unit they sell — billable engineering and support hours — gets compressed in volume and price as enterprise clients run their own agents on their own data with their own orchestration. The bull rebuttal — that Indian IT becomes the integrator of those agents — only holds if the firms reposition fast on outcome pricing and AI orchestration capability. The book is currently priced for the bull case. The transition risk is not.
- BPO and KPO — text-first workflows automate before voice. The data entry and back-office segment is exposed to the cheapest agent economics in the simulated build. Voice-heavy customer service buys two to three years of cost-curve cover before full automation becomes economical. The asymmetry favours providers who pivot text-back-office to managed-agent operations and disadvantages those running on legacy seat-based contracts.
- Engineering R&D services — closer to defensible ground. Embedded engineering, automotive, aerospace, and medical device work sits closer to product, with deeper domain integration and stickier IP. Agentic disruption arrives later and through different channels (CAD copilots, simulation agents, test automation) where these firms are positioned as deployers rather than disrupted incumbents.
- Enterprise integration and AI orchestration — the local integrator trade. The listed mid-cap integrators and the captive arms of global integrators. The integration, governance, observability, and change-management spend that the framework anticipates flows through these firms first. Smaller, more nimble players with vertical specialisation outperform legacy peers in this transition.
The Indian IT trade is no longer one trade. It is a long-orchestration, short-arbitrage pair, priced as if the second leg does not exist.
VII. THE LENS VIEW
The original investment thesis rests on three assumptions about demand, cost and value capture.
- Token demand is on a step-function path. Consensus prices this directionally but underestimates the persistence-driven multiplier from always-on agents.
- Compute cost per token is falling faster than token price is. Consensus does not yet price the gross-margin inflection at hyperscalers and leading model providers in the next three to twelve months.
- Adoption is uneven by workflow and uneven by geography. Consensus over-discounts the cheap text-first wins and under-discounts the structural pressure on services-exporting equity markets — first among them, India.
The position book is silicon first, hyperscale second, software and IT services third. The India overlay is long enterprise integration and AI orchestration; cautious on the cost-arbitrage staff-augmentation core that still trades on legacy multiples. The catalyst window is gross-margin disclosure and capex commentary across the next two earnings cycles. That is when the spread shows up in the financials, not just in the simulated builds.
Trigger is now. Flow is the always-on agent. Risk is voice latency and institutional drag. Price is the spread. Position is silicon, integration, and the short on cost-arbitrage services.
The framework asks both whether AI capex earns its cost of capital and who captures the spread if it opens.