
Original Lens and publication context
Growth, not panic, pushed the 10-year US yield to 5.11%. We test who can carry money at that price. India grows 3.3 points faster than it borrows. Its test is the dollar and the oil bill.
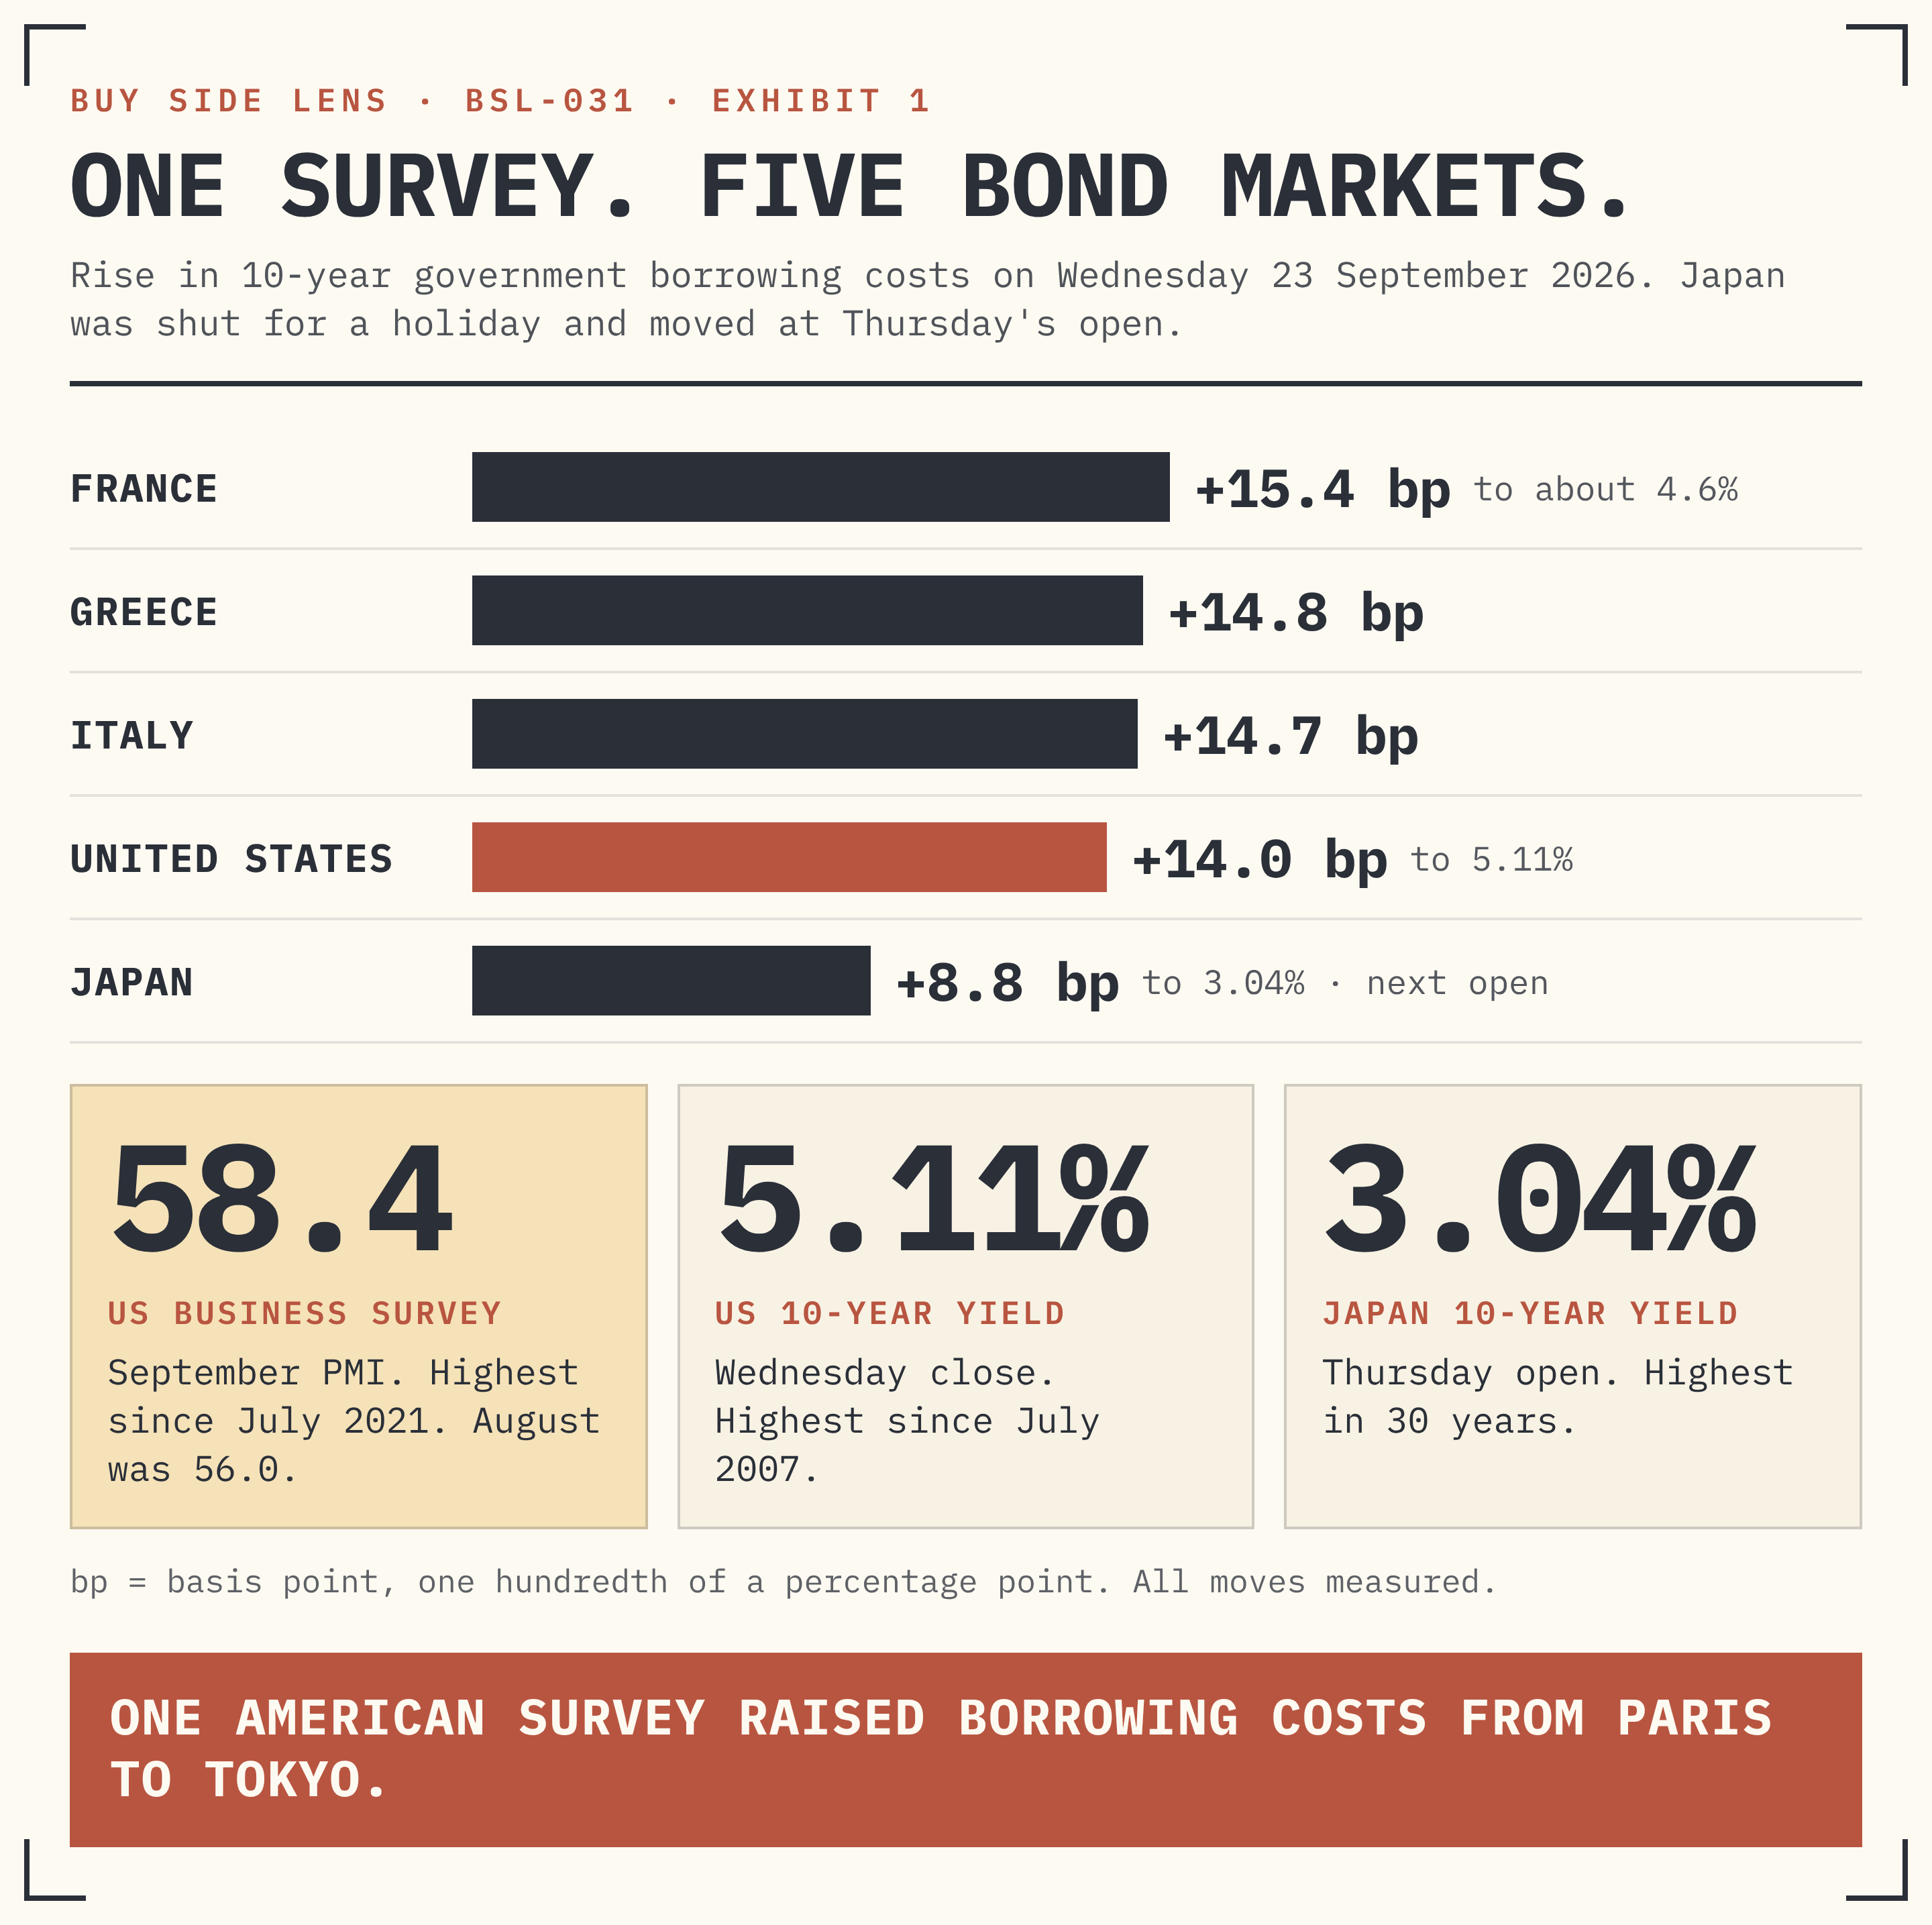
- On 23 September the 10-year US government bond yield jumped about 14 basis points to 5.11%, its highest since 2007, after a US business survey hit a five-year high.
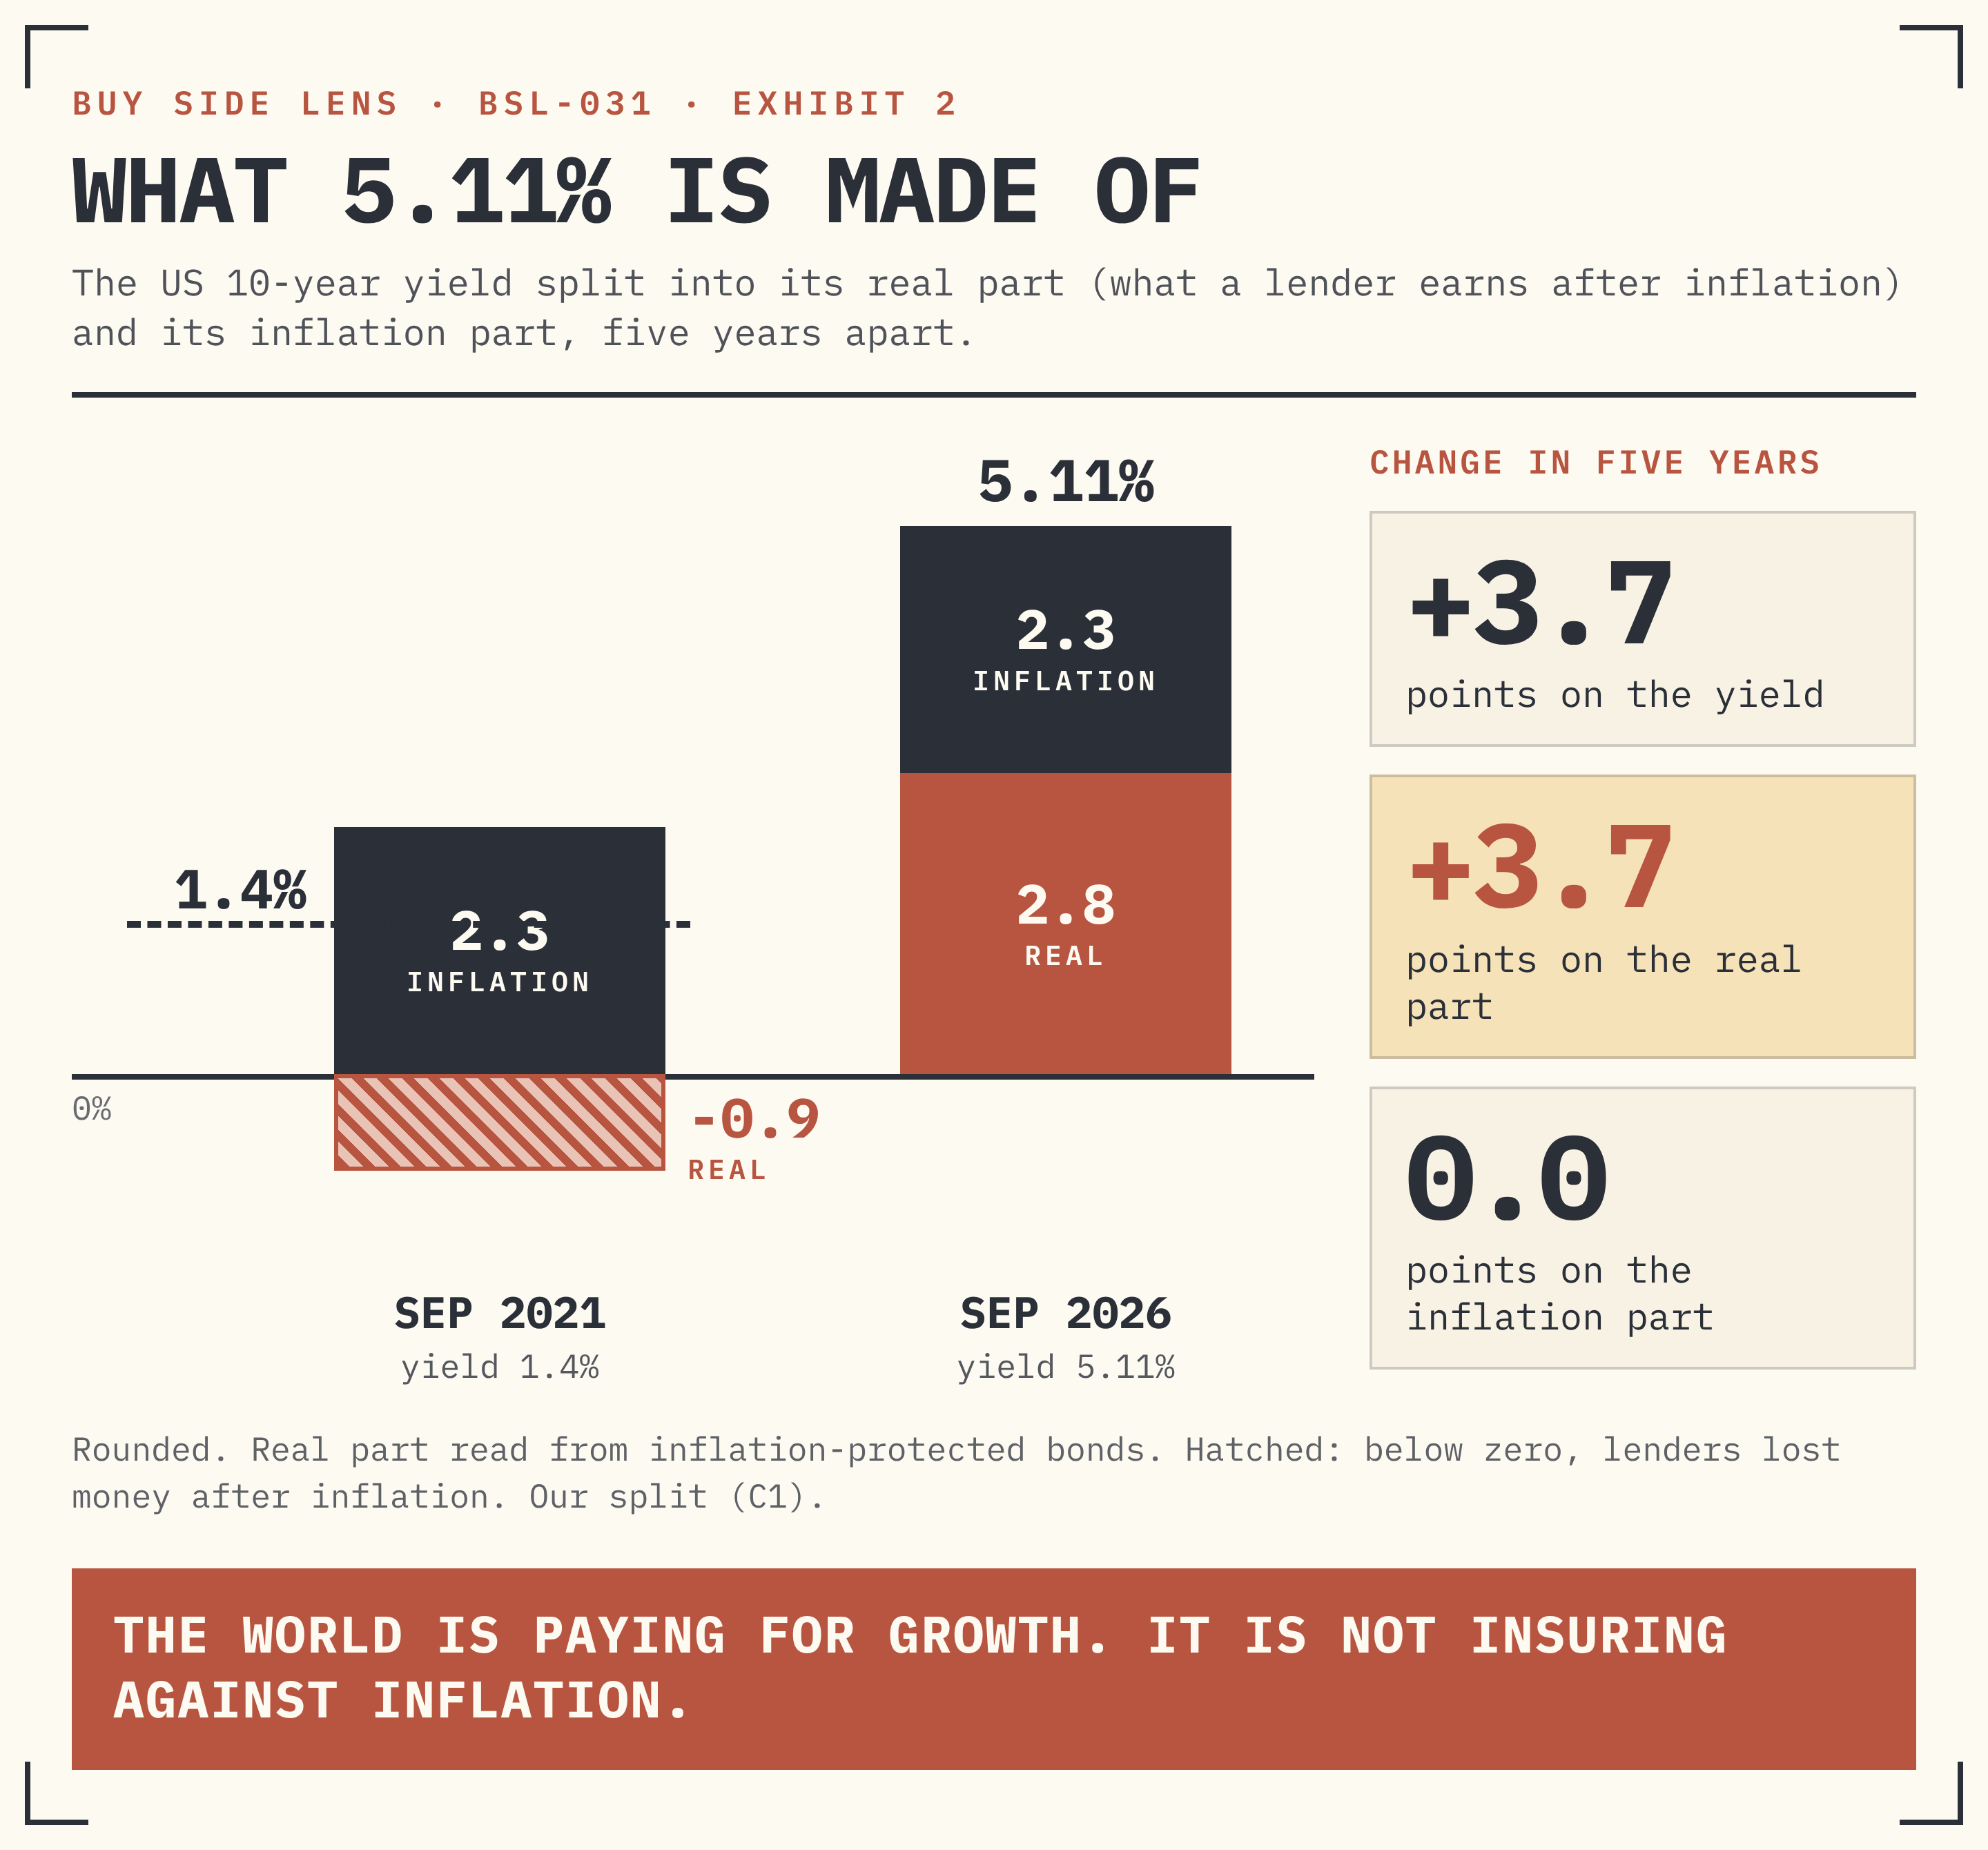
- The rise is in the real part, not the inflation part: the after-inflation yield is about 2.8%, and it explains all of the rise over five years.
- Money at this price hurts whoever grows slower than they borrow: France borrows about 2 points above its growth, India 3.3 points below.
- For India the pressure comes through the dollar and oil: the rupee is near 96, Brent is above $100, and a rate rise on 7 October is widely expected.
- India has more cushion than it looks: record reserves, debt owed at home in rupees, and growth that pulls its debt ratio down.
HOW THE 5% WORLD IS SHAPING UP
NOW · TWO DAYS, ONE CHAIN 23 Sep: US business survey at 58.4. US 10-year up 14 bp to 5.11%. France up 15.4 bp, Italy 14.7, Greece 14.8. 24 Sep: Japan's 10-year opens at 3.04%, a 30-year high. Rupee: 95.74.
WHAT MIGHT HAPPEN · BY 3 NOVEMBER 7 Oct: RBI decision; a 0.25-point rise is widely expected. 27–28 Oct: next Fed meeting. 3 Nov: US midterm vote. Futures now price seven more US rate rises than in January (C2).
WHY GROWTH, NOT PANIC Real part about 2.8%. Inflation part about 2.3%, where it stood five years ago (C1).
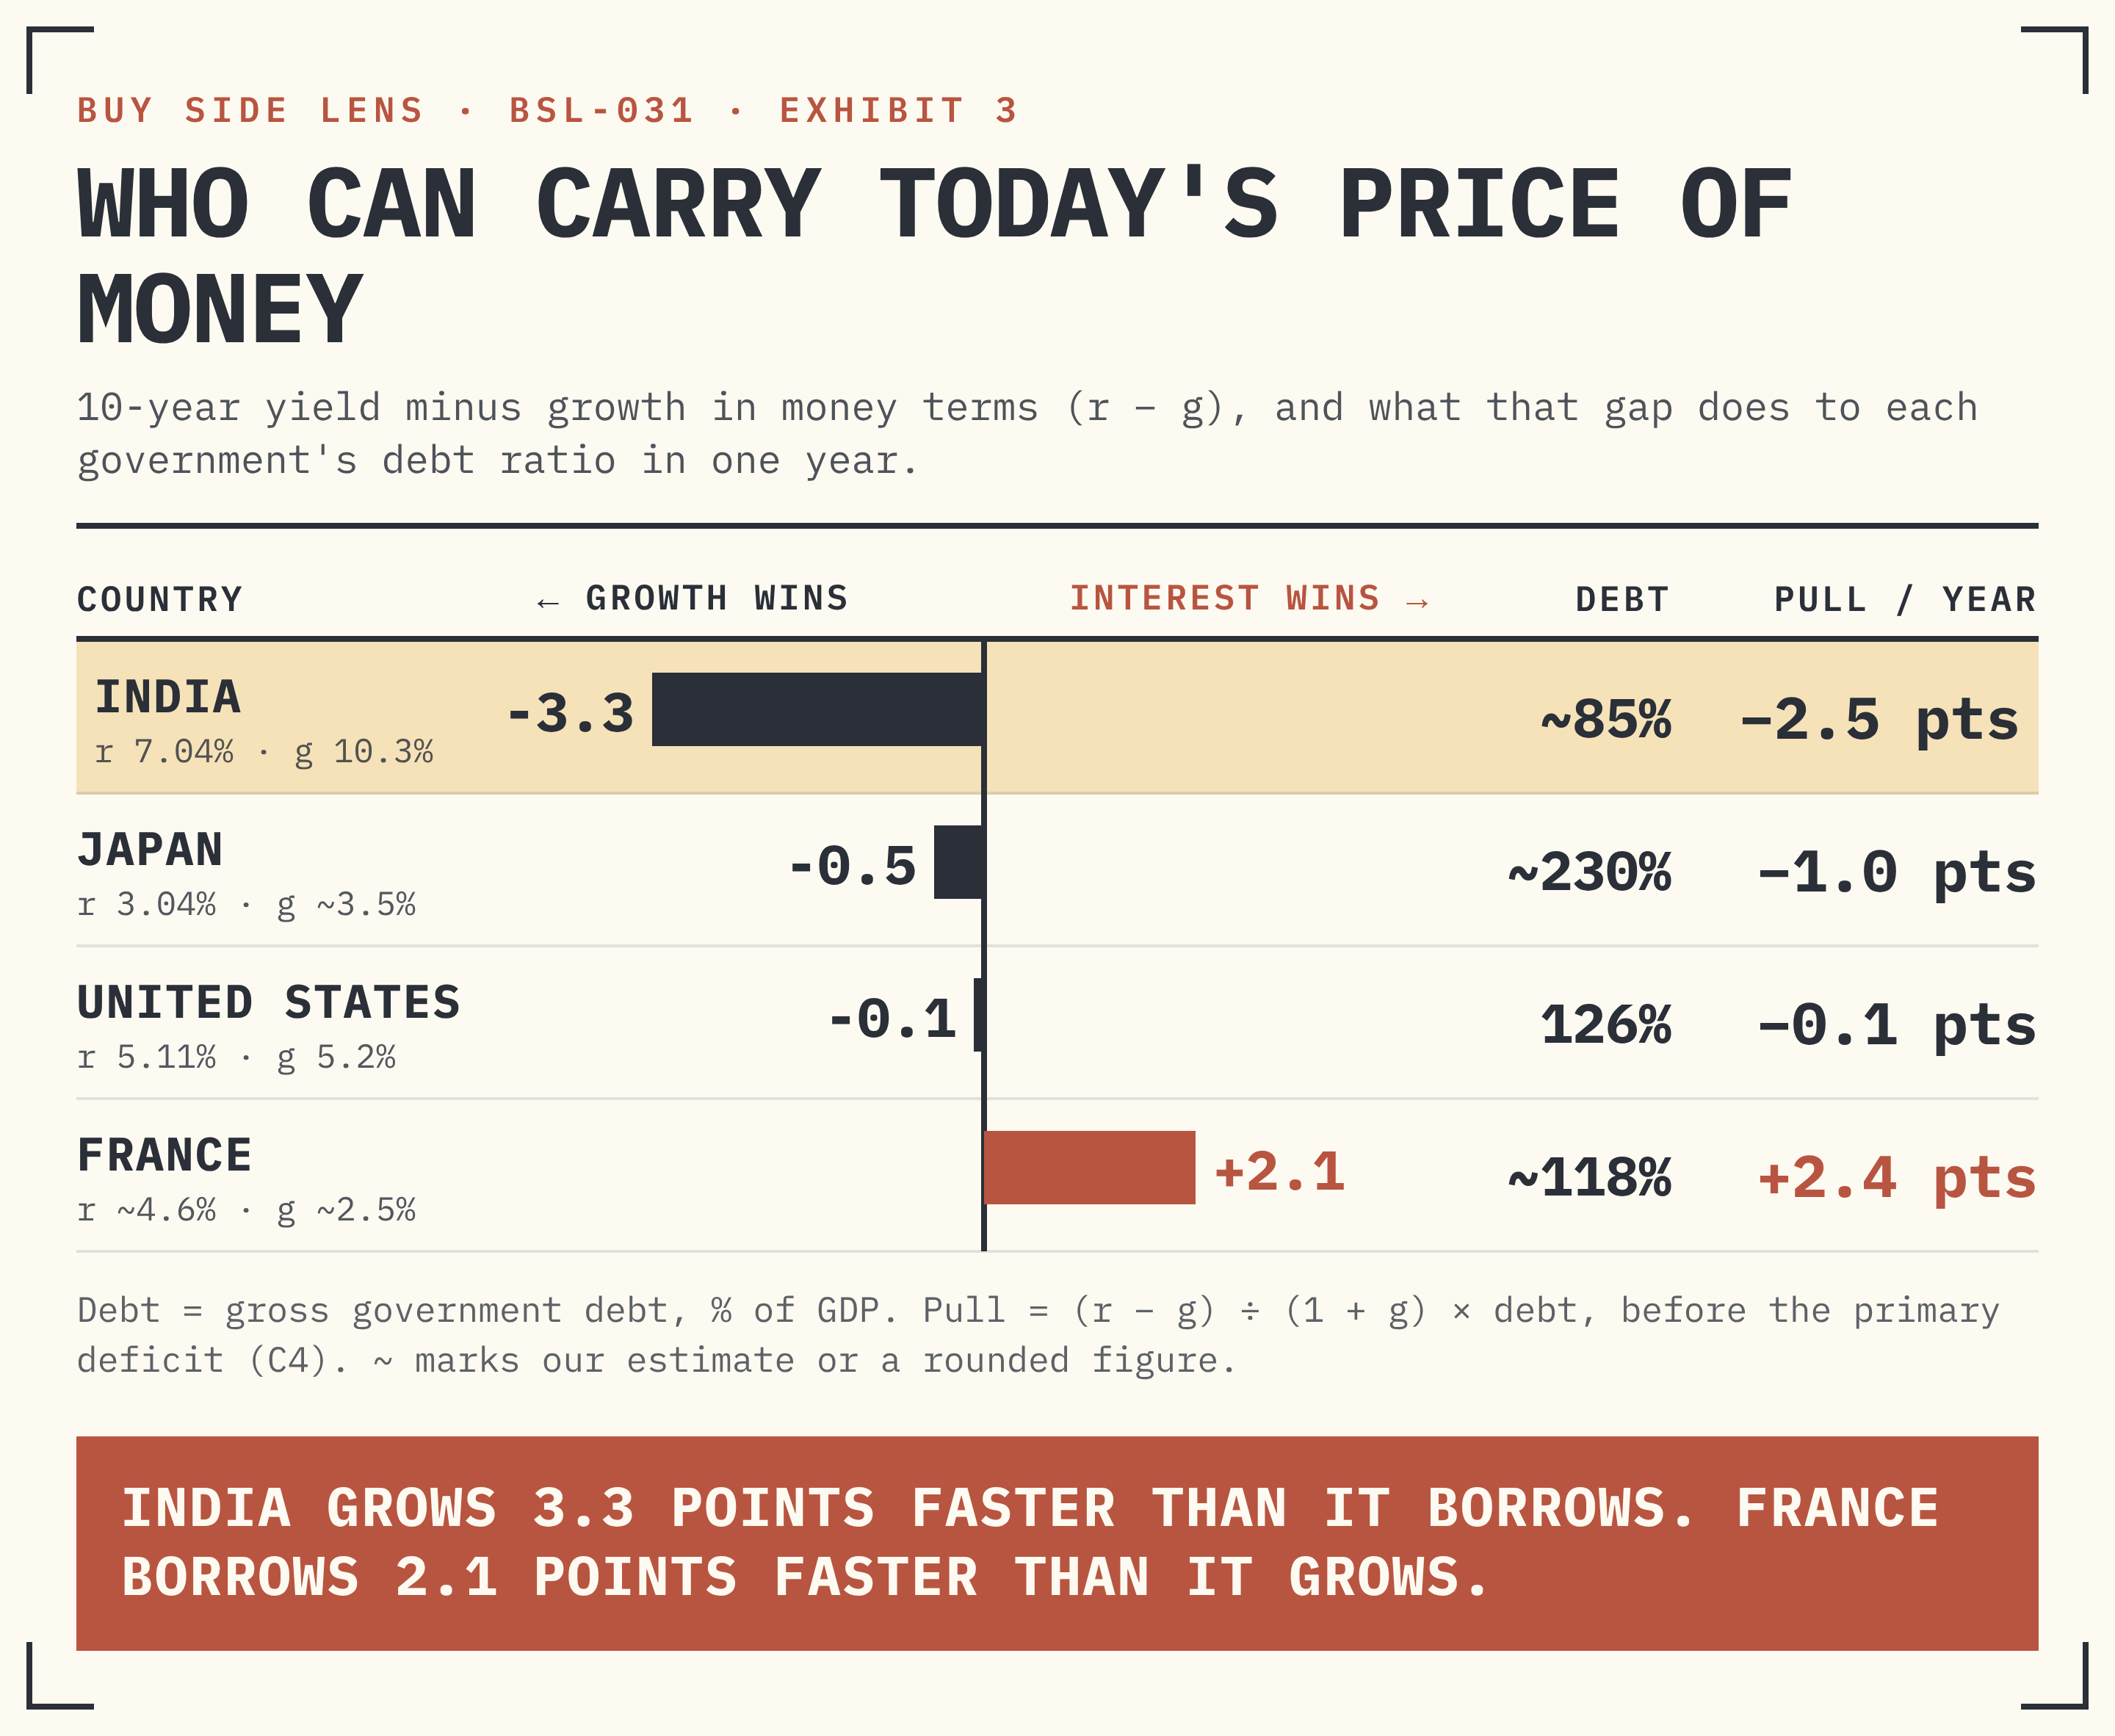
WHO CAN CARRY IT Yield minus growth: India −3.3, Japan −0.5, US −0.1, France +2.1 points (C4). Below zero, the interest–growth term reduces the debt ratio in this illustration, before the primary balance and other adjustments.
IF IT HAPPENS · THE MATHS Oil at $100 against a pre-war $72 costs India about $47bn a year (C9). Each rupee lower adds ₹16,800 crore a year to the oil bill (C10).
5.11% US 10-YEAR YIELD Wednesday close. Highest since July 2007. The five-year passed 5% too. [OBSERVED] | 7 rises ADDED TO US RATE BETS Since January: (4.75% − 3.00%) ÷ 0.25. [MODELLED · C2] | −3.3 pts INDIA: YIELD MINUS GROWTH 7.04% bond yield against 10.3% growth in money terms. [MODELLED · C4] |
HOW BUY SIDE LENS WORKS
We rebuild every number from public data. The formula sits beside the result. [OBSERVED] marks measured data. [MODELLED] marks our arithmetic on inputs we print. [INPUT] marks an assumption. C1 to C11 name each sum; the full list closes the report. A basis point (bp) is one hundredth of a percentage point. We never add numbers from different ledgers.
I. TRIGGER
One US survey moved borrowing costs on three continents.
What happened on 23 and 24 September.
On Wednesday a monthly survey of US business managers came in at 58.4. It is called the PMI. A reading above 50 means business is growing. This was the highest since July 2021. August was 56.0. Factories hired at the fastest pace since February 2021. Their costs rose at the fastest pace in four years. [OBSERVED]
- The bond move. The 10-year US government bond yield rose about 14 bp to 5.11%. That is the highest since July 2007. The five-year yield passed 5% for the first time since 2007. The 30-year touched about 5.37%. A sale of new five-year notes drew weak demand the same day. [OBSERVED]
- The Fed. On 16 September the US central bank raised its rate by 0.25 points, to 3.75%–4.00%. It was its first rise since July 2023. The vote was 12 to 0. [OBSERVED]
- The bets. In January, futures put the Fed's rate for October 2027 near 3%. Today they put it at 4.75%. That is seven more quarter-point rises. [C2]
- Europe and Japan. France's 10-year rose 15.4 bp, to about 4.6%, near its 2008 high. Italy's rose 14.7 bp. Greece's rose 14.8 bp. Japan's market was shut for a holiday. At Thursday's open its 10-year rose 8.8 bp to 3.04%, the highest in 30 years. [OBSERVED]
- Money and oil. The dollar rose. Emerging-market currencies fell to their lowest since March. Brent crude went back above $100 a barrel. The rupee closed at 95.74 per dollar. [OBSERVED]
- Homes. In the US, 30-year fixed mortgage rates are back above 7%. [OBSERVED]
Supplied archive exhibit · original labels. Read alongside the editorial corrections.
HOW TO READ THIS
Each bar is one country's 10-year yield move in a single session. A longer bar means a bigger jump in borrowing costs. The US bar is rust. The tiles show the three levels behind the news: the survey, the US yield and Japan's yield.
II. FLOW
The rise is in the real part. The inflation part has not moved.
What the yield is made of, and where the money is going.
A bond yield has two parts. The first is the real yield: what a lender earns after inflation. The second is the inflation part: the inflation the market expects over the bond's life. We read the real part from US bonds that repay inflation. [OBSERVED]
C1 / WHAT 5.11% IS MADE OF
Today. 5.11% ≈ 2.8% real + 2.3% inflation part.
September 2021. 1.4% ≈ −0.9% real + 2.3% inflation part.
Result. The yield rose 3.7 points. The real part rose 3.7 points. The inflation part rose zero. [MODELLED]
So lenders are not asking to be protected from inflation. They are asking to be paid more for their time. That happens when many people want money at once. Today that means factories, data centres and a government that borrows a lot. It is the price of growth.
Supplied archive exhibit · original labels. Read alongside the editorial corrections.
HOW TO READ THIS
Two columns, five years apart. The rust block is the real part. The dark block is the inflation part. In 2021 the real part sat below zero, so lenders lost money after inflation. Today it sits near 2.8%. The dark block is the same height in both years.
Where the money is going.
- Into US companies. Foreign buyers kept buying US company bonds and shares. Since 2021 they have put about $1.6tn into US company bonds. They have put about $1.7tn into US shares, most of it since 2025. Their buying of US government bonds has slowed, at about $2.5tn in total. There has been no rush for the exit. [OBSERVED]
- Into the machines. Firms building artificial intelligence have sold about $430bn of bonds so far in 2026. In all of 2025 they sold about $270bn. About nine-tenths came from US firms. These bonds compete with government bonds for the same savings. [OBSERVED]
- Into a bigger pile of debt. World debt hit a record of about $365tn in the first half of 2026. As a share of world output it is about 311%. That is below the 2021 peak of about 337%. Inflation made economies bigger. The pile itself did not shrink. [OBSERVED]
- Out of emerging markets. Their currencies fell to the lowest since March. Foreign funds have sold $25.9bn of Indian shares so far this year. $1.8bn of that came in September. [OBSERVED]
- Into India, by another door. Overseas Indians and banks brought in $136.4bn by 31 August. The money came through a special window for dollar deposits and borrowing. Reserves hit a record $785.7bn in the week to 4 September. [OBSERVED]
America is paying 5% because it is growing, not because its lenders are scared.
III. RISK
Money at 5% hurts whoever grows slower than they borrow.
The rule first. Then the table. Then India, alarm first.
Every government's debt follows one rule. Measure the debt as a share of the economy. The interest bill pushes that share up. Growth in the economy pulls it down. Whichever runs faster wins.
· C3
Here d is debt as a share of the economy. In the debt identity, r is the effective interest rate paid on the outstanding debt stock. The table below uses the current 10-year yield as an illustrative repricing assumption. g is nominal GDP growth; the primary deficit is spending minus revenue before interest.
Read it plainly. When g beats r, the debt ratio shrinks on its own. When r beats g, it grows on its own. The bigger the debt, the harder the pull.
Supplied archive exhibit · original labels. Read alongside the editorial corrections.
Figure 01 · Qualitative comparison
Three calculations, three different meanings
| Calculation | What is held fixed | Interpretation |
|---|---|---|
| Oil-price sensitivity | Import volume and exchange rate | Gross dollar bill changes with price |
| Rupee sensitivity | Import volume and dollar oil price | Rupee bill changes with the exchange rate |
| Debt dynamics | Effective debt cost, growth and primary balance | A scenario must state how each input evolves |
| Reserve adequacy | Assets, liabilities and maturity profile | One subtraction is not a full net-reserve assessment |
HOW TO READ THIS
Each bar is yield minus growth. Left of zero, growth outruns interest and the debt ratio shrinks by itself. Right of zero, interest outruns growth and the ratio grows by itself. The right column turns each gap into points of debt ratio a year.
, before the primary deficit (C4). r is the price of new 10-year money. Older debt costs less in the US, France and Japan; its average cost climbs toward r as old bonds are replaced. g for India is April–June, measured. g for the US is $31.9tn of output against about $30.3tn a year earlier. g for Japan and France is our estimate from real growth plus prices [INPUT]. Debt is gross government debt; for the US, $40.05tn against a $31.9tn economy.
India's number is the strongest of the four. France's is the weakest. America sits at zero. Its growth just covers the new price of money. Its debt ratio still rises, because it spends about 3% of GDP more than it taxes, before interest. [INPUT]
C7 / WHY JAPAN'S 3% CAN HURT MORE THAN INDIA'S 7%
The rule. Each 1 point on the yield moves the debt ratio by d ÷ (1 + g) points a year.
The numbers. Japan: 2.30 ÷ 1.035 = 2.2. US: 1.26 ÷ 1.052 = 1.2. France: 1.18 ÷ 1.025 = 1.15. India: 0.85 ÷ 1.103 = 0.77.
Result. Japan owes 2.3 times its yearly output. The same rise in yield does almost three times the damage there as in India. [MODELLED]
Now India. The alarm first.
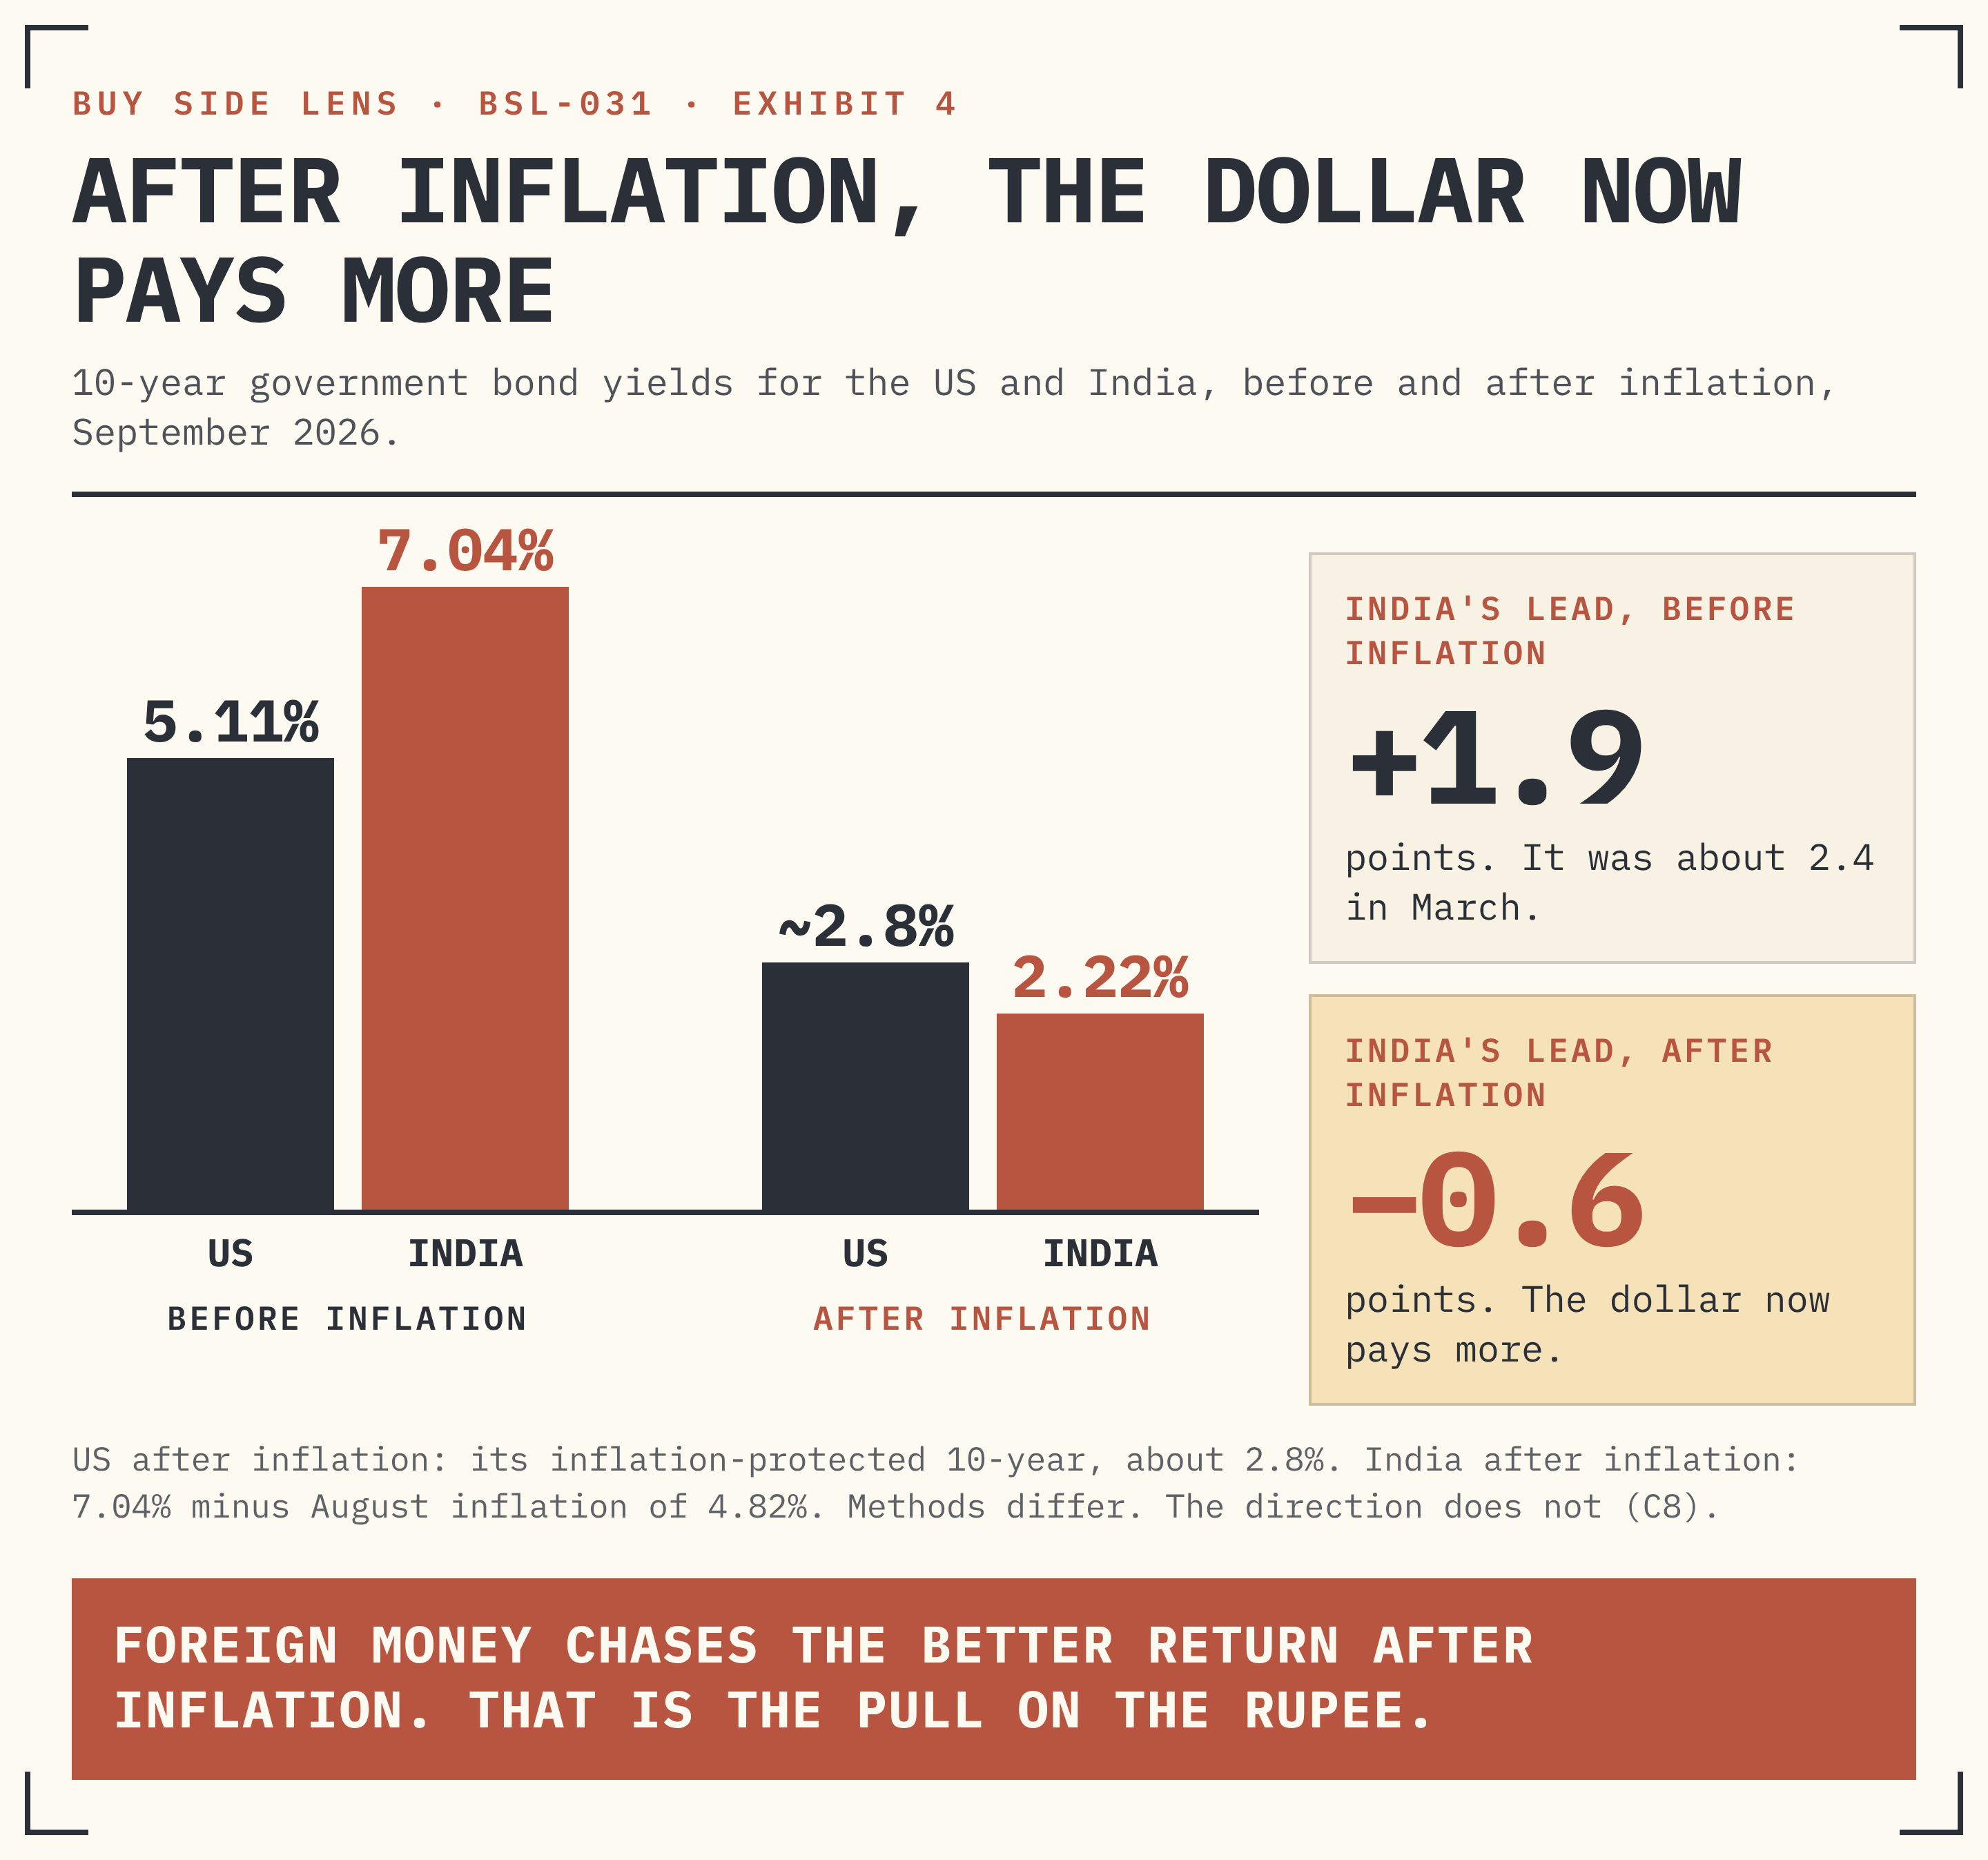
Dollar money now pays well after inflation. The US 10-year bond that repays inflation pays about 2.8% on top. India's 10-year pays 7.04%. August inflation was 4.82%. So India pays about 2.2% after inflation (C8). These two proxies are not directly comparable expected real returns: the US figure is market-implied over ten years, while the India figure subtracts one recent inflation reading. The gap between the two 10-year yields has shrunk from about 2.4 points in March to 1.9 today. That is why foreign funds are selling Indian shares. It is why the rupee sits near 96. [OBSERVED · C8]
Supplied archive exhibit · original labels. Read alongside the editorial corrections.
HOW TO READ THIS
The left pair shows yields before inflation. India pays more. The right pair shows yields after inflation. The US pays more. The US figure comes from its bond that repays inflation. The India figure is the yield minus August inflation. The methods and horizons differ, so this comparison alone does not establish a real-return ranking.
Now its size.
- India's debt is not the problem. India grows 3.3 points faster than it borrows. That pulls its debt ratio down about 2.5 points a year. Assume its governments together spend about 2% of GDP more than they tax, before interest. [INPUT] The ratio still edges down: −2.5 + 2.0 = −0.5 points a year. [C5]
- The debt is owed at home, in rupees. Indian banks, insurers, pension funds and the central bank hold most of it. A US yield cannot make India repay in dollars.
- The cushion is large. Reserves hit a record $785.7bn. The $136.4bn of special deposits sits inside that figure and must be paid back. Count it once. Subtracting those programme inflows leaves a rough$650 bn comparison, not an official measure of net or unencumbered reserves. Other liabilities, forward positions and maturities also matter. [C6]
- The real channel is oil. Brent above $100, against a pre-war $72, costs India about $47bn a year. That moves the rupee more than any US debt story. [C9]
OUR VERDICT: MORE CUSHION THAN IT LOOKS
India does not borrow dollars to run its government. Its growth beats its bond yield by 3.3 points. Its reserves are at a record. The two real costs are the oil bill and a rate rise at home, now likely on 7 October. Both come from a strong world economy. Neither says India is weak.
IV. PRICE
For India, 5% shows up in four prices.
Where the pressure lands, and how big it is.
- The rupee. It closed at 95.74 per dollar on Wednesday. The central bank has been selling dollars near the 96 line. At $100 a barrel, India buys about $168bn of crude a year. Each one-rupee fall adds about ₹16,800 crore a year to that bill. [OBSERVED · C10]
- The RBI rate. The repo rate is the rate at which the RBI lends to banks. It is 5.25%. The next decision is on 7 October. A rise of 0.25 points is widely expected. This month the RBI is also taking ₹1 lakh crore out of the banks by selling bonds. [OBSERVED]
- The 10-year bond. India's 10-year yield was 7.04% on 22 September. It started the year near 6.6%. The gap over the US 10-year is now about 1.9 points. [OBSERVED]
- The oil bill. India imports about 4.6 million barrels a day. Each $1 on Brent costs $1.68bn a year. Each $10 costs $16.8bn. The gap from $72 to $100 costs about $47bn. [MODELLED · C9]
Three paths from here, priced. We set a Brent price and a rupee level for each path. The crude bill follows from the arithmetic. [INPUT · C11]
PATH | WHAT THE US SHOWS | BRENT · RUPEE | INDIA'S CRUDE BILL A YEAR | WHAT IT MEANS FOR INDIA |
|---|---|---|---|---|
Growth holds | US 10-year stays 5.0–5.3%. Inflation part near 2.3%. | $100 · ₹96 | $168bn · ₹16.1 lakh cr | The RBI raises on 7 October. The debt math still works. The rupee stays the pressure point. |
Growth fades | US survey below 52. US 10-year falls toward 4.5%. | $85 · ₹94 | $143bn · ₹13.4 lakh cr | Relief for the rupee and for long Indian bonds. One RBI rise may be the last. |
Fear takes over | Inflation part above 2.6%, or deficit worry. US 10-year above 5.5%. | $110 · ₹98 | $185bn · ₹18.1 lakh cr | More RBI rises. More foreign selling. The debt math still holds. The oil bill bites. |
Crude bill = 4.6 mb/d × 365 × Brent; rupee bill = dollar bill × rupees per dollar (C11). Brent and rupee levels are our settings for each path, not forecasts. The gap between the best and worst path is about ₹4.7 lakh crore a year, about 1.2% of GDP. [MODELLED]
Five prices to watch.
- The US inflation part. It sits near 2.3%. A climb above 2.6% would mean the rise has turned from growth into inflation fear. That is the bad kind.
- The US business survey. At 58.4 it explains the yield. A fall below 52 would pull US yields down and give India room.
- The rupee at 96. The central bank has held this line. A clean break would raise the rupee cost of oil and every other import.
- The RBI on 7 October. A rise is priced. Watch what it says about the next one.
- Brent at $100. Each $10 moves India's oil bill by $16.8bn a year.
India's debt can carry 5% money. The rupee has to carry the oil bill.
THIS HAS HAPPENED BEFORE. THREE TIMES.
When money gets dear, it finds whoever needs it most.
Start with one rule. A debt is a claim on work not yet done. It is safe when the work grows faster than the claim. It breaks when the claim grows faster than the work. Interest is the speed of the claim. Growth is the speed of the work. No law and no promise can change which one runs faster.
1262–1381 In 1262 Venice gathered its war debts into one fund. It paid 5% a year. Citizens had to lend in line with their wealth. They could sell their claims to others. While Venice's ships traded, 5% was easy to pay. The claims sold close to full value. Then came war with Genoa, from 1378 to 1381. Trade stopped. Venice borrowed more and more. Its debt grew to six to nine times its 1344 level. It stopped paying interest from 1379. The claims fell as low as 19 for every 100. Peace came and trade came back. The price climbed back to about 60. The 5% never changed. The ships did.
1778–1789 Britain and France fought the same wars. Both borrowed heavily. Britain paid about 3% to 5%. France paid 6% to 10%. Britain's tax take grew with its trade and new industry. France's did not. Its nobles and clergy paid little tax. By 1788 interest took about half of the French crown's spending. The crown could not borrow more. The Estates-General met in May 1789. Revolution followed that summer. Britain carried the bigger debt, and kept going.
2013 In May 2013 the US central bank hinted it would slow its bond buying. The US 10-year yield rose from about 1.6% to about 3% by September. Money left the countries that needed it. India needed it most. Its current-account deficit was 4.8% of GDP. Markets grouped it with four others as the "Fragile Five". The rupee fell from about 55 to a record 68.85 on 28 August. India closed the gap. It curbed gold imports. It raised about $34bn from overseas Indians through a special dollar deposit window. The deficit fell to 1.7% of GDP the next year. The rupee steadied.
Three eras, one shape. Venice paid 5% easily while its ships sailed, and could not when they stopped. France could not raise its income to meet its interest. India in 2013 needed foreign money for a deficit it could not fund at home. When money gets dear, it finds whoever needs it most. In 2026 India's government borrows at home and grows faster than it pays. It has already raised $136.4bn from overseas Indians and banks, about four times the 2013 total. What India still needs from abroad is oil. So watch the rupee and the oil bill. Not the debt.
V. POSITION
What we would do.
We talk about groups of companies. We do not name single shares.
- Indian government bonds: short and medium over long ones. Add no long bonds before the 7 October decision.
- Banks whose loans mostly move with the repo rate: hold a normal amount. A rate rise lifts what they earn on loans before what they pay on deposits.
- Lenders that raise their money in the bond market: hold less than normal until the RBI's path is clear.
- Companies with big dollar debts and rupee income: hold less than normal while the rupee sits near 96.
- Exporters paid in dollars (IT services, generic medicines): hold a normal amount. US demand is strong, and a weaker rupee lifts their rupee income. Add more to IT only when a firm shows sales rising while its headcount stays flat.
- Heavy oil users (paints, tyres, airlines, logistics): stay selective while Brent is above $100.
- Refiners: keep refining profit over the oil price.
- Expensive shares priced on profits far in the future: trim, do not exit. A higher world price of money cuts what distant profits are worth today.
- Gold and dollar-linked assets: keep as insurance. They pay twice in rupees if oil and the dollar rise together.
- Emerging-market bonds in local currency, outside India: hold less than normal while the dollar rises.
Horizon: three months. Review: 24 December 2026.
THE TAPE
What the prices must show to change our view.
SIGNAL | LEVEL | WHAT WE WOULD DO |
|---|---|---|
US 10-year inflation part | Above 2.6% for two weeks | The rise has turned into inflation fear. Trim expensive long-dated shares further. |
US business survey (PMI) | Below 52 | Growth is fading and US yields should fall. Start adding long Indian bonds. |
RBI, 7 October | A rise, with more signalled | Keep banks at normal. Keep bond-market lenders light. |
The rupee | Weaker than 96.50 per dollar for a week | Add to gold and dollar-linked insurance. |
India–US 10-year gap | Below 1.5 points | Foreign bond money is at risk. Move to the shortest Indian bonds. |
Brent | Above $110 for a month | Cut what you expect heavy oil users to earn. |
Brent | Below $85 for a month | Add to heavy oil users. |
Japan 10-year | Above 3.5% | Japanese savers bring money home. Hold less of expensive long-dated shares everywhere. |
THE ARITHMETIC / C1 – C11
The sums are simple. The definitions do the work.
CALCULATION | FORMULA AND RESULT | LIMIT |
|---|---|---|
C1 Yield split | 5.11 ≈ 2.8 + 2.3; Sep 2021: 1.4 ≈ −0.9 + 2.3; change 3.7 = 3.7 + 0.0 | Rounded. The inflation part also carries a small risk premium. |
C2 Rises priced | (4.75 − 3.00) ÷ 0.25 = 7 | Futures for October 2027 used as the end point. |
C3 Debt rule | Leaves out one-off items and currency moves. | |
C4 Pull from r − g | India (7.04 − 10.3) ÷ 1.103 × 0.85 = −2.5; Japan (3.04 − 3.5) ÷ 1.035 × 2.30 = −1.0; US (5.11 − 5.2) ÷ 1.052 × 1.26 = −0.1; France (4.6 − 2.5) ÷ 1.025 × 1.18 = +2.4 | r is the price of new money. g for Japan and France is our estimate. |
C5 India in full | −2.5 + 2.0 = −0.5 points a year | The 2% primary deficit for all governments together is an assumption. |
C6 Gross reserves less selected inflows | 785.7 − 136.4 = 649.3 ≈ $650bn | Special deposits are repaid over several years. |
C7 Sensitivity | d ÷ (1 + g): 2.30 ÷ 1.035 = 2.2; 1.26 ÷ 1.052 = 1.2; 1.18 ÷ 1.025 = 1.15; 0.85 ÷ 1.103 = 0.77 | Points of debt ratio a year for each 1 point of yield. |
C8 Real yields | India 7.04 − 4.82 = 2.2; US ≈ 2.8; gap 7.04 − 5.11 = 1.9; March 6.67 − 4.25 = 2.4 | India uses today's inflation. The US uses bonds that repay inflation. |
C9 Oil bill | 4.6 × 365 × $1 = $1.68bn; × 10 = $16.8bn; × (100 − 72) = $47.0bn | August import volume. Price effect only. |
C10 Rupee on oil | 4.6 × 365 × $100 = $168bn; × ₹1 = ₹16,800 crore | At $100 Brent. Leaves out hedging. |
C11 Three paths | 1,679m bbl × $100 × 96 = ₹16.1 lakh cr; × $85 × 94 = ₹13.4 lakh cr; × $110 × 98 = ₹18.1 lakh cr; 18.1 − 13.4 = 4.7 ÷ 382 = 1.2% of GDP | Path prices are settings, not forecasts. GDP of ₹382 lakh crore is FY26 grown 10.3%. |
THE BUY SIDE LENS METHOD · SIX CHECKS, AS RUN IN THIS REPORT
Rebuild, do not repeat. "Seven more rises" is our sum from two futures prices (C2). It is not a quoted figure.
Separate observed from modelled. Yields, prices and flows are measured. Debt pulls are modelled. Every figure carries its tag.
Never add ledgers. Reserves, share sales and the oil bill sit in different ledgers. We compare their sizes. We never sum them.
Check the bottom number. $40 trillion is the US federal debt: the stock of what is owed. The yearly deficit is a flow, and far smaller. Every ratio here divides by output in money terms.
Count once. The $136.4bn of special deposits is already inside the $785.7bn of reserves. It is owed back. We count it once (C6).
Print the assumption beside the result. Growth for Japan and France, and India's 2% primary deficit, sit next to the sums they drive.