Original Lens and publication context
Decoding the MSCI May 2026 rejig: why a zero-sum index reshuffle still drains a billion dollars, where the real dislocation sits, and why the Nifty 50 barely flinches.
- MSCI's semi-annual Standard Index review takes effect at today's close: four stocks in, four out, the Indian constituent count flat at 165 and India's weight steady at 12.3% against 12.4% prior. On the surface, a balanced rebalance.
- Netting every leg — inclusions of roughly +$1.38 billion, exclusions of about –$715 million, the float-adjustment weight-down book and the lower country weight — India sees a net passive outflow of roughly $800 million to $1 billion. The float-down leg decides the sign.
- The sector pattern is a textbook rotation: capital exits IT services, premium staples, market-leader autos and PSU energy through weight cuts, and rotates into private and public-sector banks, telecom and the freshly included commodity names.
- Dollar flow is not price impact: the four exclusions carry flow-to-liquidity ratios of 10x, 10x, 6x and 4x average daily volume, none in the Nifty 50; the Nifty heavyweights losing the most dollars sit at or below 1x. The Smallcap Index shrinks to 459 names.
- Position: the Nifty 50 sees minimal net MSCI impact — banks and telecom bid, IT, staples and PSU energy offered, largely cancelling at index level. Position for single-stock dislocation in the 3:00–3:30 PM IST closing trading window, not for an index event; the smallcap book matters more.
Executive Summary
MSCI's semi-annual Standard Index review takes effect at the close of trading today, May 29, 2026. On the surface it reads as a balanced rebalance — four stocks in, four stocks out, constituent count flat at 165, India's Standard Index weight steady at 12.3% against 12.4% prior. Our reading, once every leg of the flow is accounted for, is that India sees a net passive outflow of roughly $800 million to $1 billion. The two facts are not in tension; they describe different layers of the same event, and this report works through each.
This report resolves the apparent contradiction, maps the flows to sector buckets, isolates the stocks carrying genuine price risk, and quantifies the realistic effect on the Nifty 50. The central conclusion: this is a rotation, not a directional money event. The violence is concentrated in four exclusions and the smallcap book — none of which are Nifty 50 constituents. The index itself absorbs the shuffle with offsetting flows and high underlying liquidity.
The four named deletions are not in the Nifty 50; they are not necessarily the four largest dollar outflows across all weight changes. The most violent MSCI selling does not touch the index that matters to most portfolios.
Analytical Framework: Trigger → Flow → Risk → Price → Position
This analysis follows the Buy Side Lens five-step structure. We begin with the event mechanics (Trigger), trace the capital movement by sector and by index tier (Flow), isolate where that movement concentrates into genuine danger (Risk), translate dollar flows into expected price behaviour via the liquidity lens (Price), and close with the actionable read for an institutional book (Position).
1. Trigger — The Mechanics of the May 2026 Review
MSCI runs a semi-annual reconstitution of its Global Standard Index. The May 2026 cycle was announced May 13 and is implemented at the market close on May 29. For India, the Standard Index — which by MSCI's own definition captures the large- and mid-cap segments combined, roughly 85% of the investable universe — sees four inclusions and four exclusions, leaving the constituent count unchanged at 165.
The MSCI Standard Index combines large- and mid-cap segments; MSCI also publishes separate size-segment indexes. This report focuses on the combined Standard review. Below it sits a distinct Smallcap Index, which is where the heavier structural action occurred this cycle.
Three distinct mechanisms drive flow in this review: (a) full inclusions and exclusions; (b) float-adjustment weight changes (the 'Non-FF' and 'float adj' columns), where a stock stays in the index but its weight rises or falls; and (c) the country-level weight move within the broader MSCI Emerging Markets index, which governs the aggregate passive dollar flow into or out of India.
INCLUSIONS (STANDARD) | EST. INFLOW $MN |
|---|---|
Federal Bank | 483 |
Multi Commodity Exchange | 362 |
National Aluminium | 328 |
Indian Bank | 206 |
EXCLUSIONS (STANDARD) | EST. OUTFLOW $MN |
|---|---|
Hyundai Motor India | (278) |
Jubilant Foodworks | (151) |
Kalyan Jewellers | (131) |
Rail Vikas Nigam | (118) |
The displayed inclusion rows sum to $1,379 million and the displayed exclusion rows to $678 million, giving a net $701 million on those rows. The original quoted aggregates of $715 million in exclusions and $665 million net require reconciliation. That figure on its own would suggest an inflow — but it is only the first of three flow legs, and the other two reverse the sign.
On the displayed inclusion-versus-exclusion rows in isolation, estimated buying exceeds selling by $701 million. The net outflow comes entirely from the float-down leg.
2. Flow — Where the Capital Moves, by Sector
Aggregating the per-stock expected flows from the official tables into broad sector buckets reveals the rotation clearly. The dominant inflow vector is private and public-sector banking, reinforced by telecom and the commodity inclusions; the dominant outflow vector is information technology, large-cap staples, autos and PSU energy via float-down weight cuts.
INFLOWS — Inclusions and Weight-Up (Exp $mn)
NIFTY SECTOR | APPROX INFLOW $MN | LEADING NAMES |
|---|---|---|
Financials / Banks | ~1,890 | Federal 483, Indian Bank 206, ICICI 169, Axis 74, Kotak 51 |
Telecom | ~412 | Bharti Airtel 412 |
Commodities / PSU | ~690 | NALCO 328, MCX 362 |
Energy / Power | ~230 | Reliance 196, NTPC 41, Suzlon 14 |
Capital Goods / Infra | ~180 | L&T 65, Adani Ent 64, GE Vernova 16 |
Metals / Materials | ~110 | Tata Steel 38, Grasim 21, JSW Steel 19 |
Consumer / FMCG | ~110 | Titan 35, Asian Paints 24, ITC 21 |
Auto | ~90 | Eicher 24, TVS 19, Bajaj Auto 17 |
OUTFLOWS — Exclusions and Weight-Down (Exp $mn)
NIFTY SECTOR | APPROX OUTFLOW $MN | LEADING NAMES |
|---|---|---|
Information Technology | (450) | TCS (140), Infosys (125), HCL Tech (46), Wipro (16) |
Auto | (430) | Hyundai (278), M&M (109), Maruti (56), Tata Mtrs (46) |
FMCG / Consumer | (360) | HUL (194), Nestle (103), Dabur (37) |
Power / PSU Energy | (330) | ONGC (122), Coal India (111), Power Grid (95) |
Financials | (300) | Bajaj Finance (204), SBI Cards (26), Muthoot (22) |
Cement / Materials | (290) | UltraTech (125), Pidilite (24), Astral (24) |
Pharma / Healthcare | (280) | Cipla (60), Sun Pharma (59), Max Health (48) |
Capital Goods | (120) | ABB (76 combined), Siemens (28), Havells (11) |
The pattern is a textbook factor rotation: capital exits the crowded, high-quality compounder complex — IT services, premium staples, market-leader autos — and rotates into financials and the freshly included mid-cap names. This is consistent with the relative-value repricing that has run through Indian equities through the first half of 2026.
Exhibit A — Official Weight-Up (Non-FF) Book, Table 2/2
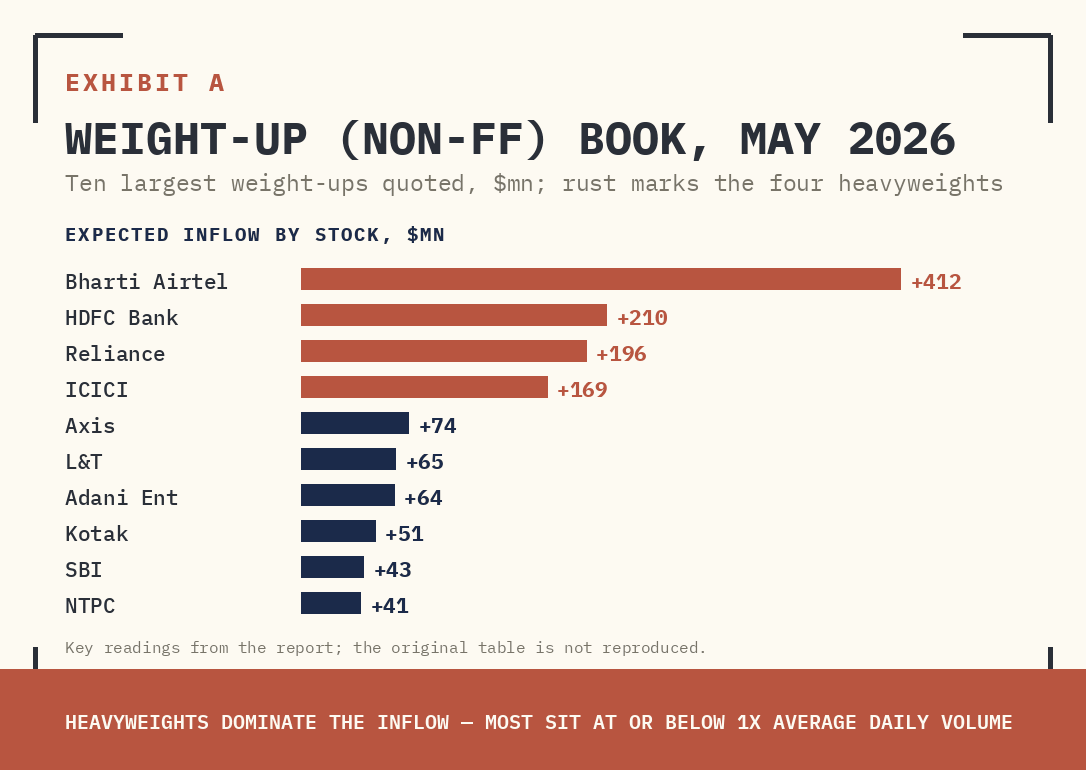
Supplied archive exhibit · original labels. Read alongside the editorial corrections.
Exhibit A is the weight-up leg in full. Note the concentration at the top: Bharti Airtel (+412), HDFC Bank (+210), Reliance (+196) and ICICI (+169) dominate the inflow, all index heavyweights. The 'Avg Vol (X)' column confirms these are highly liquid — most sit below or near 1x average daily volume, meaning the buying is comfortably absorbed and exerts limited upward price pressure despite the large dollar tags.
Figure 01 · Conceptual framework
From index changes to potential price impact
3. Risk — Netting the Three Legs to a Number
The displayed inclusion-versus-exclusion rows net to +$701 million; the original +$665 million aggregate estimate is not reconciled to those rows. But that is not the whole picture, and reading it in isolation would mislead. There are two further legs to add, and both run the other way.
The first is the float-adjustment weight-down leg — stocks that remain in the index but have their weight reduced. This is a large book: Bajaj Finance, Hindustan Unilever, ONGC, Maruti, Mahindra, Coal India, UltraTech, Nestle and a long tail behind them. Each of these releases passive dollars without leaving the index, and in aggregate the weight-down dollars considerably exceed the weight-up dollars. The second is the country-weight move itself: India's Standard Index weight eases from 12.4% to 12.3%. That looks negligible, but the beta of the move is what matters — a ~10 basis-point reduction applied across the very large pool of passive capital that tracks the benchmark scales into real money.
Putting all three legs together — inclusions and exclusions, the float-adjustment weight-down book, and the country-weight reduction — our estimate is a net passive outflow of roughly $800 million to $1 billion from Indian equities at this rebalance. The add/drop surplus is simply overwhelmed by the weight-down leg and the lower country weight.
FLOW LEG | DIRECTION | MAGNITUDE $MN |
|---|---|---|
Inclusions | Inflow | +1,380 |
Exclusions | Outflow | (715) |
Weight-Up (float adj) | Inflow | + (smaller) |
Weight-Down (float adj) | Outflow | (larger) |
NET INDIA | Outflow | (800) to (1,000) |
Exhibit B — Inclusions, Exclusions and Weight-Down Book, Table 1/2
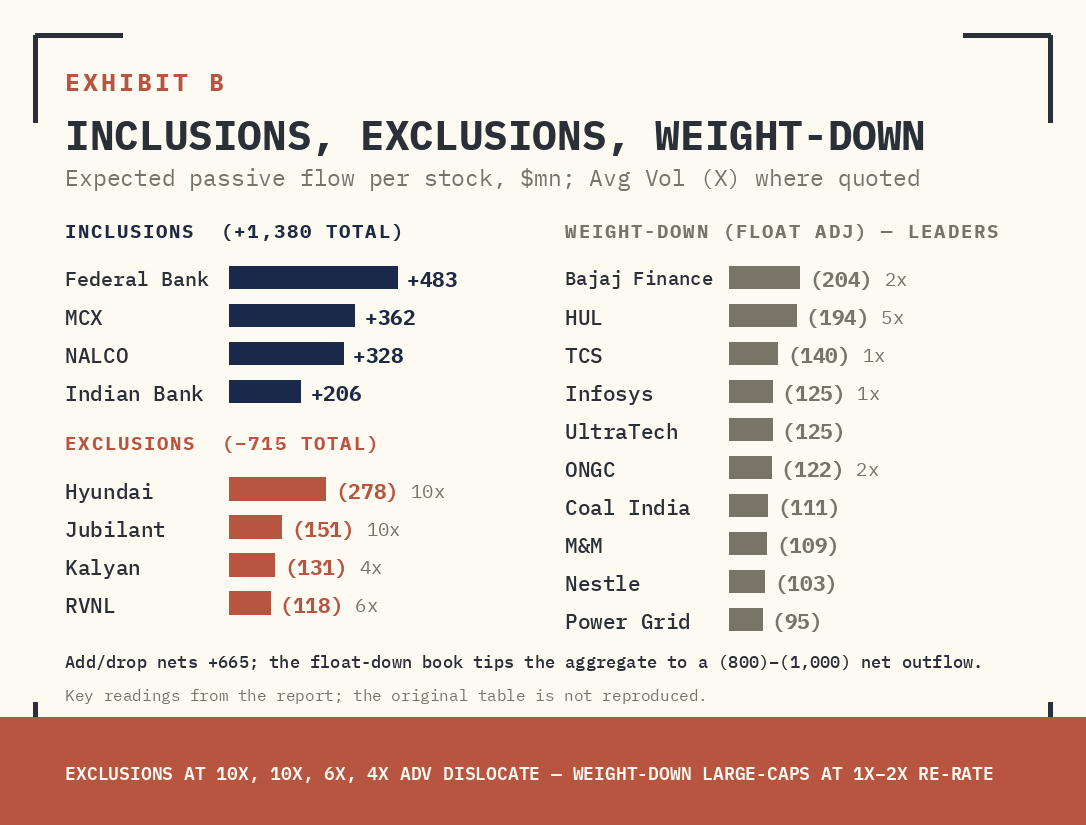
Supplied archive exhibit · original labels. Read alongside the editorial corrections.
Exhibit B shows the full picture in one frame. The green inclusion block (Federal +483, MCX +362, NALCO +328, Indian Bank +206) and the orange exclusion block (Hyundai –278, Jubilant –151, Kalyan –131, RVNL –118) net positive. But the large 'Wt down (float adj)' block beneath — running from Bajaj Finance through the entire right-hand column — is what tips the aggregate negative. Critically, the 'Avg Vol (X)' column is where the danger hides: the exclusions show 10x, 10x, 4x and 6x respectively, while most weight-down large-caps sit at 1x–2x. That single column separates the names that dislocate from the names that merely re-rate.
Inflows, exclusions, weight-down, country weight — net all four and the answer is an $800 million to $1 billion outflow. The float-down book is the leg that decides the sign.
A second, larger structural story sits outside the Standard Index entirely. The MSCI Smallcap Index loses over a dozen Indian constituents this cycle, with the count falling from 474 to 459 — driven by sustained smallcap underperformance through recent months. Several names demoted from Standard (Jubilant, Kalyan) are migrating down into Smallcap rather than leaving the universe. For a book with smallcap exposure, this is the more consequential development.
4. Price — Dollar Flow Is Not Price Impact
A common analytical error in reading a rejig table is equating the largest dollar outflow with the largest price move. Price impact is not the dollar figure; it is the dollar figure divided by liquidity. The relevant column is Avg Vol (X) — the flow expressed as a multiple of the stock's average daily traded volume. A $200 million sell order in a name that turns over $300 million a day is noise; the same order in a name trading $20 million a day is a dislocation.
STOCK | OUTFLOW $MN | AVG VOL (X) | IN NIFTY 50? |
|---|---|---|---|
Hyundai (excl.) | (278) | 10x | No |
Jubilant (excl.) | (151) | 10x | No |
RVNL (excl.) | (118) | 6x | No |
Kalyan (excl.) | (131) | 4x | No |
Bajaj Finance | (204) | 2x | Yes |
TCS | (140) | 1x | Yes |
HUL | (194) | 5x | Yes |
Infosys | (125) | 1x | Yes |
ONGC | (122) | 2x | Yes |
The hierarchy is decisive. The exclusions include several high flow-to-liquidity ratios and all four sit outside the Nifty 50, but the report also lists HUL at 5x versus Kalyan at 4x. These are the names facing potential closing-period trading pressure in the final thirty minutes of the session. By contrast, the large-cap Nifty heavyweights bleeding the largest dollar amounts — TCS, Infosys, ONGC — are mostly at or below one times average daily volume. Their MSCI flow is comfortably absorbed by ordinary turnover.
5. Position — The Effect on the Nifty 50
The net effect of the rejig on the Nifty 50 index level is small and broadly neutral-to-mildly-negative. Three structural reasons drive this muted outcome.
- The largest outflow in the entire review — Hyundai, at (278) and 10x ADV — is not a Nifty 50 constituent. Neither are Jubilant, Kalyan or RVNL. The four most violent selling events bypass the Nifty 50 entirely.
- The Nifty's own outflow names are highly liquid. TCS, Infosys, HUL, ICICI, Reliance, ONGC, Coal India, M&M and UltraTech all see MSCI flow that is small relative to their daily turnover — passive selling here is absorbed without meaningful price dislocation.
- Inflows offset inside the index. Bharti Airtel (+412), Reliance (+196), ICICI (+169), Axis (+74), L&T (+65), SBI (+43) and NTPC (+41) are all top Nifty weights receiving weight-up. These bids materially offset the weight-down drag from IT and staples.
The net read is a mild intra-index rotation rather than a directional move: banks and telecom bid, IT, staples and PSU energy offered, with the two largely cancelling at the index level. Any MSCI-attributable move in the Nifty 50 is likely to fall within normal daily noise and to concentrate in the closing trading window between 3:00 and 3:30 PM IST.
The Nifty 50 sees minimal net MSCI impact. The dislocation is in the four exclusions and the smallcap book — watch the market-on-close, not the index print.
Conclusion
Our conclusion is straightforward. Add up the four flow legs — inclusions, exclusions, the float-adjustment weight-down book, and the lower country weight — and this review produces a net passive outflow of roughly $800 million to $1 billion from Indian equities. The add/drop leg is positive; the weight-down leg and the reduced beta to the benchmark are what carry the aggregate into negative territory. But the number alone is misleading without the composition. That outflow is concentrated in a particular set of names — four exclusions (Hyundai, Jubilant, Kalyan, RVNL) plus a smallcap book shedding fifteen constituents — and those names do not drive the Nifty 50. The index's own heavyweights are either receiving inflows (Bharti, Reliance, ICICI, Axis, SBI) or seeing weight-down flows small enough relative to their daily liquidity to be absorbed without a meaningful price move. The headline figure is an outflow; the practical impact on the Nifty 50 is close to neutral. An institutional desk should position for single-stock dislocation at the close, not for an index event.