
Original Lens and publication context
India's benchmark index has arrived at a major technical support cluster — a convergence of the 200-day moving average, key Fibonacci retracement levels, and prior breakout zones. The market is forcing a binary question on every institutional desk: is this a durable low, or a temporary bounce inside a larger distribution? The answer, filtered through macro and flow mechanics, is neither clean nor comfortable.
- The Nifty 50 has arrived at a multi-layer support cluster: weekly trendlines from the June 2022 lows, point-and-figure support where the May 2025 breakout began, end-of-March seasonality, a forward P/E back near its 10-year average of about 18.6x, and Ichimoku 76- and 172-week cycles converging.
- A valuation reset, not a crisis: the index traded at roughly 23–24x at the September 2024 peak against a long-run mean of 20x, FII outflows since October 2024 exceed ₹2.5 lakh crore, and the rupee has crossed 87–88 per dollar.
- Flow is the decisive variable: the RBI held the repo rate at 5.25% in February 2026 following earlier easing, SIP inflows above ₹21,000 crore a month absorb every FII sale, and FII selling is decelerating but not reversing; a real rally needs FII re-entry.
- Price: if the cluster holds, a 7–10% technical bounce toward 23,500–24,000 is the base case; year-end bear/base/bull of 20,500 / 23,800 / 26,500 at 20% / 55% / 25%. Cluster failure is two consecutive weekly closes below the 200-DMA, with the next support 8–12% lower.
- Position: a buying zone, not a conviction bet. Stage entry at 30–40% of intended allocation, rotate toward rate-sensitives and capital goods and away from consumption, avoid mid- and small-caps, hedge with gold. This is most likely a tactical bottom, not a secular one.
I. WHAT THE CHART IS ACTUALLY SAYING
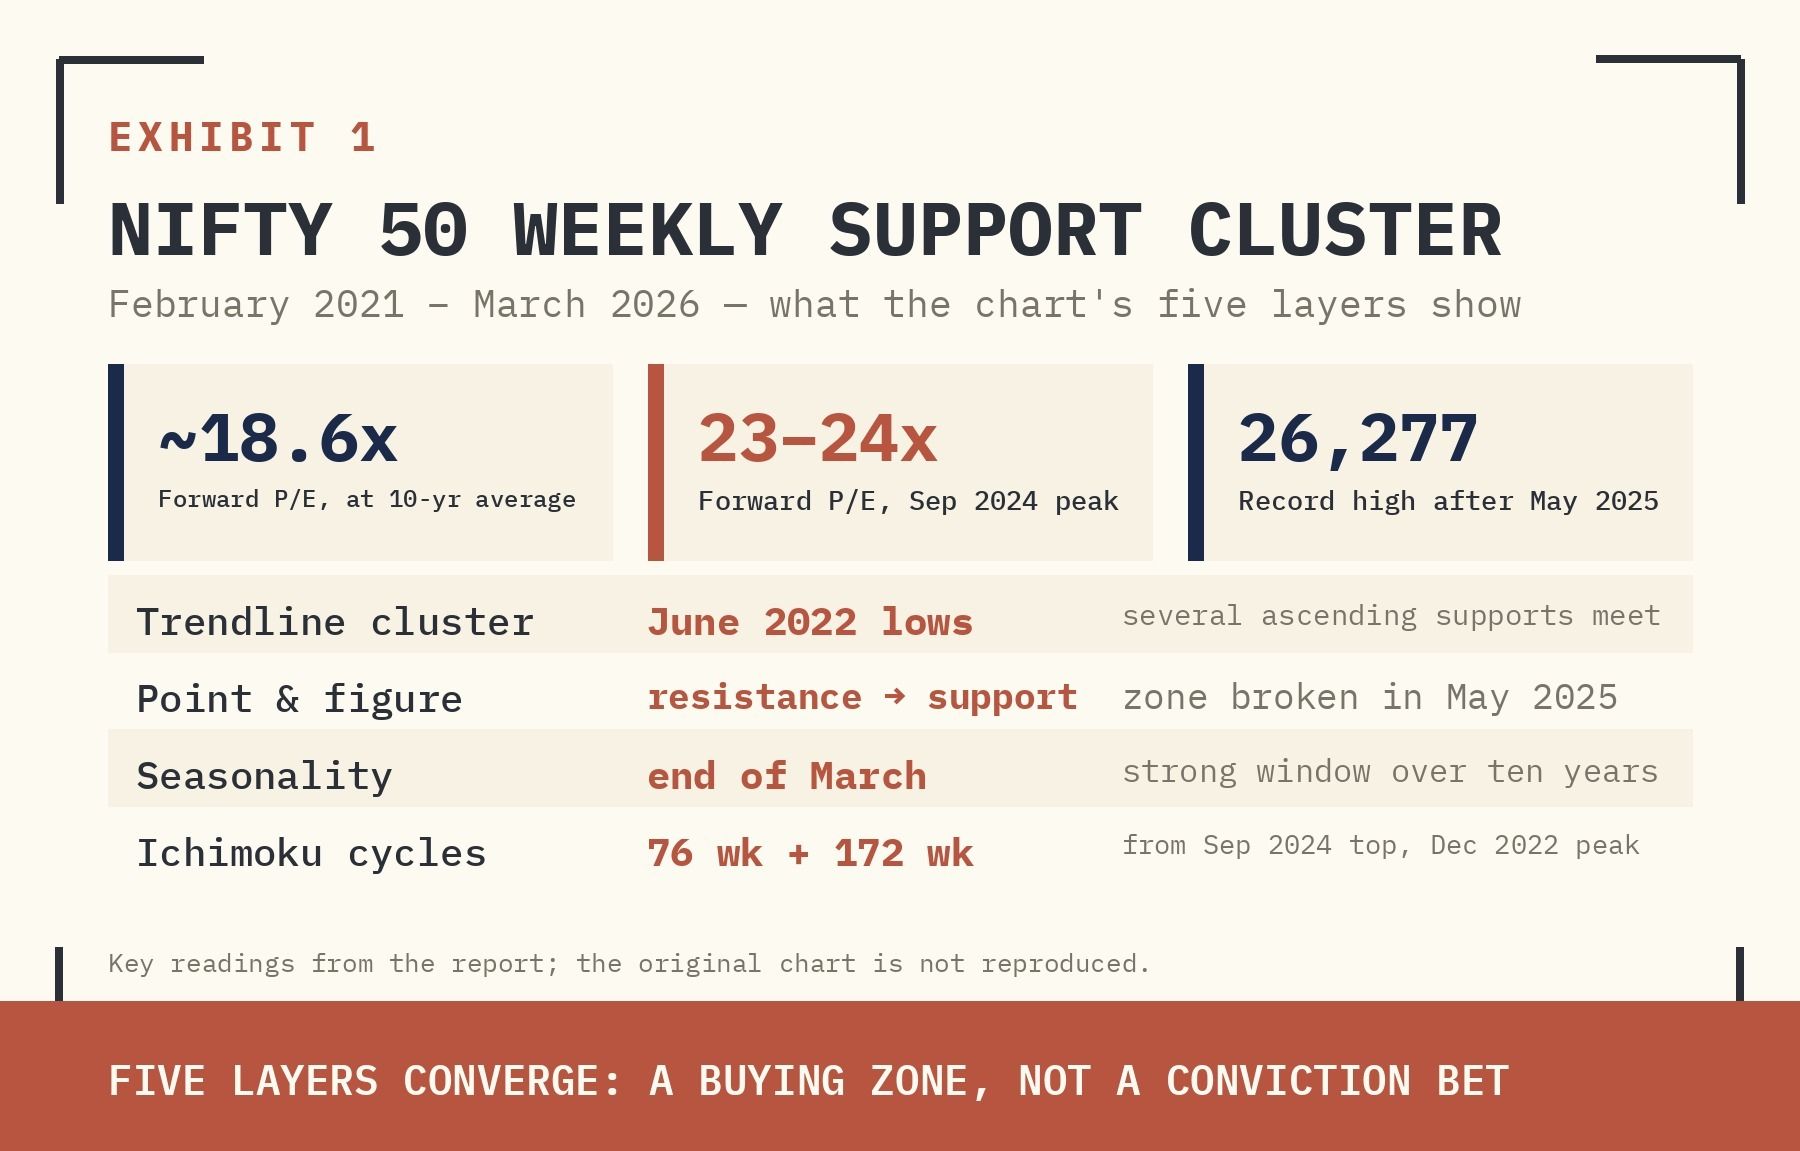
Supplied archive exhibit · original labels. Read alongside the editorial corrections.
The chart, on a weekly timeframe spanning February 2021 to March 2026, immediately poses the central question every institutional desk is now wrestling with: is what follows a genuine trend reversal, or merely a temporarily bullish minor bounce inside a larger corrective structure? The answer is not academic — it determines position sizing, entry discipline, and hedging strategy for the remainder of FY2026.
1. The Weekly Trendline Support Cluster — Origin: June 2022
The Nifty 50's current drop has sent the benchmark to a cluster of weekly trendline supports — marked by the red circle on the chart — originating from the June 2022 lows. This is not a single trendline but a convergence of multiple ascending support vectors, each drawn from meaningful prior lows across the 2022-2024 recovery cycle. When price arrives at a zone where several independently-drawn trendlines intersect simultaneously, the signal-to-noise ratio for a support reaction increases substantially. Systematic and rules-based funds programme buy triggers at exactly these zones. The June 2022 origin is critical — it is the base of the entire post-COVID recovery leg, making a decisive break below it structurally bearish in a way that a correction within the trend is not.
2. Point-and-Figure Chart: Support from Prior Resistance
The point-and-figure (P&F) inset in the top-left of the chart provides a second, entirely independent confirmation. P&F analysis strips out the noise of time and minor price fluctuations, recording only meaningful directional moves. The current reading shows that the Nifty is now sitting at support derived from a prior resistance area — specifically, the resistance zone that, when broken to the upside in May 2025, triggered the large breakout rally that ultimately carried the index to its record highs near 26,277. In classical technical analysis, prior resistance, once broken decisively, converts to support on the retest. The P&F chart is confirming that this conversion is in effect. The implication: this is not arbitrary price support — it is structurally anchored support with institutional memory.
Prior resistance that triggered a record-breaking breakout in May 2025 is now acting as support. The Point-and-Figure chart confirms structural memory at this zone — not arbitrary price coincidence.
3. Seasonal Tailwind: End-of-March Historically Strong
Decade-long seasonal data adds a third dimension of support. Analysis of Nifty 50 monthly return patterns over the past ten years consistently shows that the period around the end of March represents a seasonally strong window — driven by a combination of institutional year-end rebalancing (Indian financial year closes March 31st), mutual fund NAV management, tax-loss harvesting reversal, and fresh-year allocation mandates that deploy capital in April. This seasonal pattern does not guarantee a rally, but it does mean that the path of least resistance is upward during this window, and that the support cluster is being tested at a time when the calendar itself is a tailwind rather than a headwind.
4. 12-Month Forward P/E Near 10-Year Average: The Valuation Anchor
The inset chart in the bottom-right corner of the chart tracks the Nifty 50's 12-month forward price-to-earnings ratio from 2016 to March 2026. The current reading — circled in green — is hovering near the 10-year average of approximately 18.6x. This is the single most important fundamental data point in the entire chart. At the September 2024 peak, the Nifty was trading at approximately 23-24x forward earnings — well above its historical mean and pricing in a near-perfect earnings acceleration that did not materialise. The compression from 23-24x to ~18.6x represents the unwinding of that valuation excess. At 18.6x forward earnings, the index is not cheap by global EM standards, but a reasonable amount of froth has been eliminated relative to recent history. The green circle on the P/E inset is effectively an institutional buy signal: the valuation argument for overweighting India, which had been difficult to make at peak multiples, is now materially more defensible.
At ~18.6x forward P/E — the 10-year average — the Nifty's valuation argument is no longer a stretch. The froth of the 2024 peak has been compressed. This is where long-horizon institutional capital finds its entry.
The four elements — trendline cluster from June 2022 lows, P&F resistance-turned-support confirmation, end-of-March seasonal strength, and forward P/E reversion to the 10-year mean — are not individually sufficient to call a bottom. But their simultaneous presence at the same price zone creates a multi-dimensional support architecture that the buy side cannot ignore. The chart's own framing of this as a potential 'temporarily bullish minor bounce event' is appropriately cautious — but the weight of evidence leans toward a more durable inflection, conditional on the macro conditions discussed in the sections that follow.
5. Ichimoku Time Cycle Confluence: The 76-Week and 172-Week Alignment
A fifth and less widely-discussed dimension of support at this juncture comes from Ichimoku Kinko Hyo time cycle theory. Technical analysts tracking Nifty through this framework have flagged that two major time cycles are converging around the current period — specifically, 76 weeks from the September 2024 top, and 172 weeks from the December 2022 peak. This is not coincidence; it is the mathematical expression of a phenomenon known as time confluence.
Ichimoku theory, developed by Japanese journalist Goichi Hosoda over decades of empirical market research, embeds specific time cycles as structural building blocks. The standard cycles are 9 (short), 26 (medium), 52 (major), and 76 (extended). Beyond these, Hosoda identified very large cycles at 129 and 172 — multiples and harmonics of the base numbers. The underlying logic is not mystical; it reflects the idea that institutional positioning, options expiry structures, earnings seasons, and macro policy cycles tend to produce recurring rhythms in price behaviour. When two independent large cycles — one measuring 76 weeks forward from a major top, another measuring 172 weeks forward from a prior significant peak — arrive at the same calendar window, technical analysts treat that window as elevated for volatility and potential directional inflection.
76 weeks from the September 2024 top. 172 weeks from the December 2022 peak. Two Ichimoku extended cycles arriving simultaneously — not a prediction, but a timing window of elevated significance.
The macro hashtags accompanying such analysis — oil, tariffs, Fed/Powell, Iran, Israel, Hormuz, dollar/rupee — are not decorative. They represent the catalogue of catalysts that, if triggered during the technical timing window, would convert a cycle-driven inflection point into an observable price move. The Ichimoku practitioner's argument is precisely this: the cycle tells you when volatility is likely to crystallise; macro tells you which direction it resolves. In the current environment, the macro catalogue is heavily loaded — any one of these catalysts, individually, is capable of forcing a 5-8% directional move in Nifty.
One important calibration for Indian markets: historical back-testing of Ichimoku time cycles on Nifty suggests that the classic Hosoda numbers (9, 26, 52) work less reliably than in Japanese equity markets — likely because India's market microstructure, FII ownership patterns, and quarterly earnings calendar create slightly different rhythmic signatures. The extended cycles (76, 172) have shown better empirical fit with Nifty's major turning points, which is why their current alignment is being flagged by serious practitioners rather than dismissed as numerology. The November 2021 top, the June 2022 low, the December 2022 peak, and the September 2024 high all sit within 2-3 weeks of major Ichimoku cycle counts from prior significant price events.
The professional-grade use of this analysis is precise: time cycles identify windows of potential volatility, not direction. They are most useful when they confirm what price structure, flow mechanics, and macro analysis are already suggesting independently. In the current case, the Ichimoku time confluence is the fifth independent signal pointing to the same March 2026 window — adding a temporal dimension to a support case that was already being built on four other foundations. It does not change the positioning framework. It strengthens the conviction that this window matters.
II. THE MACRO ARCHITECTURE: INDIA IN MARCH 2026
Global Headwinds Feeding the Correction
The Nifty's decline to this support cluster is not a domestically-generated crisis. The dominant force has been persistent Foreign Institutional Investor (FII) outflows — running at historically elevated magnitudes since Q3 2024 — driven by a global repricing of Emerging Market risk premiums. Three global factors have structurally pressured EM equities:
- US Dollar Strength: The Federal Reserve's higher-for-longer posture, combined with Trump administration tariff rhetoric and fiscal expansion, has kept the DXY elevated, making dollar-denominated assets more attractive relative to EM equities.
- China's Partial Recovery: Beijing's targeted stimulus has begun reviving Chinese consumer and industrial activity. Global EM fund managers are rotating from India — which re-rated to premium valuations — back into cheaper Chinese assets.
- Geopolitical Risk Premium: Ongoing uncertainty across the Middle East, continued Russia-Ukraine dynamics, and US-China tech decoupling have elevated global risk aversion, compressing the multiple that investors are willing to pay for growth assets.
India-Specific: The Valuation Reset
The Indian market entered this correction cycle with a significant structural vulnerability: elevated valuations. Nifty 50's trailing P/E at the September 2024 peak was approximately 23-24x — roughly one standard deviation above its long-run mean of 20x. A return to mean-valuation, even without earnings deterioration, implied a 10-15% compression in index levels. Combined with a mild earnings downgrade cycle — driven by margin pressure from elevated input costs, subdued urban consumption, and IT sector demand uncertainty in the US — the correction found fundamental validation.
India's correction is not a crisis. It is a necessary compression of a premium that ran too far ahead of the earnings cycle. The support cluster is where mean-reversion meets structural support.
The RBI Policy Pivot: The Critical Domestic Variable
The Reserve Bank of India's monetary policy trajectory is the single most important domestic macro variable for the equity markets at this juncture. After maintaining an extended pause amid global uncertainty and sticky core inflation, the RBI had already eased policy during 2025. At its February 2026 meeting, it kept the repo rate unchanged at 5.25% with a neutral stance.
This matters for the support cluster in a specific way: rate cuts reduce the discount rate applied to future earnings, mechanically lifting intrinsic valuations. For rate-sensitive sectors — banking, real estate, infrastructure — the impact is direct and immediate. The question is whether the pace of cuts is sufficient to offset the earnings headwinds and FII selling pressure simultaneously.
Fiscal Policy: The Capex Engine
The Union Budget for FY2026-27 maintained the government's commitment to capital expenditure — the single most reliable domestic demand driver over the past three years. The allocation for infrastructure spending remains elevated at approximately ₹11 lakh crore, with continued emphasis on roads, railways, defence manufacturing, and the PLI scheme. This capex cycle creates a durable earnings floor for engineering, capital goods, and construction companies — sectors that are often the first to recover at market bottoms.
Rupee Dynamics: Silent Macro Pressure
The Indian Rupee has depreciated meaningfully — crossing the 87-88 per US Dollar range — reflecting the cumulative effect of FII outflows, elevated crude oil import bills, and global dollar strength. Rupee depreciation creates a dual pressure on the equity market: it raises import costs (pressuring margins for import-dependent industries) and makes Indian assets cheaper in dollar terms for foreign investors to re-enter. At some inflection point, the depreciation itself becomes a valuation argument for inbound FII flows — but that re-entry signal has not yet triggered at scale.
III. THE BUY SIDE LENS: TRIGGER → FLOW → RISK → PRICE → POSITION
The Buy Side Lens is a five-step proprietary analytical framework that moves from macro catalyst identification through to actionable portfolio positioning. Applied to the current Nifty 50 support cluster:
01 TRIGGER | THE CONVERGENCE TRIGGER IS MULTI-LAYERED: (1) TECHNICAL — NIFTY REACHES THE 200-DMA / FIBONACCI 61.8% ZONE, TRIGGERING SYSTEMATIC BUYING FROM QUANT AND RULES-BASED FUNDS; (2) POLICY — EARLIER RBI EASING PROVIDES A POTENTIAL VALUATION SUPPORT, WHILE FEBRUARY 2026 POLICY WAS ON HOLD; (3) SEASONAL — Q4 FY26 EARNINGS SEASON CREATES A BINARY EVENT FOR MARKET DIRECTION. EACH OF THESE TRIGGERS IS INDEPENDENTLY MEANINGFUL; THEIR SIMULTANEOUS ARRIVAL AMPLIFIES THE SIGNAL. |
|---|---|
02 FLOW | Flow mechanics are the decisive variable. FII selling — which drove the correction from September 2024 highs — has shown early signs of deceleration, though not reversal. Domestic Institutional Investors (DIIs), powered by systematic monthly SIP inflows now exceeding ₹21,000 crore per month, have been consistent absorbers of every FII sale. Retail participation via derivatives and direct equity remains elevated. The flow picture suggests the floor is being defended domestically — but a genuine rally requires FII re-entry as a catalyst, not merely the cessation of selling. |
03 RISK | Four risks can break the support cluster decisively: (1) A negative Q4 earnings surprise — if corporate India's March quarter numbers disappoint on both revenue and margin fronts, the technical support becomes irrelevant; (2) US Federal Reserve hawkishness — any renewed dollar rally driven by sticky US CPI would reignite FII outflows; (3) Crude oil spike — India imports approximately 85% of its crude requirements; a sustained move above $90/barrel would widen the current account deficit, pressure the rupee, and import inflation — forcing the RBI to pause its easing cycle; (4) China macro acceleration — a stronger-than-expected Chinese recovery would pull global EM flows further away from India. |
04 PRICE | At the support cluster, the risk-reward is asymmetric in favour of longs — but only tactically. If the cluster holds, a 7-10% technical bounce toward the 23,500-24,000 zone is the base case. The structural question — whether Nifty makes new all-time highs in calendar year 2026 — requires earnings acceleration that is not yet visible in analyst consensus. Price targets for the year-end range: Bear case 20,500 (cluster fails, FII selling intensifies), Base case 23,800 (cluster holds, mild recovery), Bull case 26,500 (FII re-entry + earnings upgrade cycle begins). Probability weighting: 20% / 55% / 25%. |
05 POSITION | The cluster is a buying zone — not a conviction bet. Position sizing should be staged: initial entry at current levels (30-40% of intended allocation), with additional tranches reserved for either a successful retest of the cluster (adds conviction) or a break below (stops out). Sector rotation toward rate sensitives (banking, infrastructure) and away from consumption/FMCG. Avoid midcap and smallcap — the valuation gap vs. largecap has not fully closed. Hedge with gold and shorter-duration fixed income. |
IV. INSTITUTIONAL FLOW DECOMPOSITION
Understanding who is buying and selling at the support cluster is as important as the price level itself. The current flow structure, decomposed by participant category:
- Foreign Portfolio Investors (FPIs/FIIs): Net sellers since late 2024. Cumulative outflows from Indian equities in the October 2024 – February 2026 period exceeded ₹2.5 lakh crore. The selling has been concentrated in financial services, IT, and consumer discretionary — sectors that carried the highest FII ownership. De-rated valuations are beginning to make Indian large-caps globally competitive, but FII re-entry is a process, not an event.
- Domestic Mutual Funds (DMFs): Systematic net buyers. SIP inflows provide a mechanical bid each month regardless of market direction. This structural DII bid is what makes every dip shallower than the previous cycle. DMFs have deployed aggressively in large-cap indices, acting as the dominant price support mechanism.
- Insurance Companies (LIC, Private Life): Significant counter-cyclical buyers. Mandate-driven, long-duration, and price-insensitive within ranges. LIC's equity AUM provides an additional structural floor at significant correction levels.
- Retail/HNI via Derivatives: Elevated open interest in Nifty puts at and below the support cluster levels signals retail hedging — but also creates a technical setup where dealer gamma positioning forces buying as the market approaches support (the hedge direction depends on dealer net exposure; put open interest alone does not establish positive gamma).
V. SECTOR POSTURE AND PORTFOLIO POSITIONING
The following positioning framework applies to a 12-month horizon from the current support cluster level:
SEGMENT | STANCE | RATIONALE |
|---|---|---|
Largecap Quality | OVERWEIGHT | Defensive anchor in a volatile environment. Large-cap index constituents with strong balance sheets, pricing power, and low beta relative to mid/smallcap. Preferred segment for initial re-entry at the support cluster. |
BFSI — Private & PSU Banks | NEUTRAL → POSITIVE | Direct beneficiaries of the RBI rate-cut cycle. Net interest margin dynamics improving. Asset quality metrics stabilising after the NBFC stress cycle. Watch for Q4 FY26 NIM guidance as the upgrade trigger. |
Capital Goods & Infrastructure | OVERWEIGHT | Budget capex allocation of ~₹11 lakh crore sustains a multi-year order book cycle for the sector. Earnings visibility is higher here than in most other segments. A structural overweight irrespective of near-term index direction. |
IT Services | NEUTRAL | US client discretionary spend remains uncertain. Sector awaits Q4 FY26 revenue guidance for clarity on whether the demand trough is behind. Not the segment to overweight at a support cluster — add only on guidance upgrade. |
FMCG & Consumption | UNDERWEIGHT | Rural recovery is slower than consensus expects. Input cost normalisation is being offset by volume softness. Valuations in the segment remain relatively full despite the broader market correction. Avoid overweighting. |
Midcap & Smallcap | UNDERWEIGHT | Valuation premium vs. largecap has not fully compressed despite the correction. Risk-reward does not favour chasing this segment at the current cluster level. Revisit after a confirmed base with two consecutive weeks of largecap stability. |
Gold & Commodity Hedges | OVERWEIGHT | Portfolio hedge against rupee depreciation, crude oil volatility, and global risk-off events. Allocation via sovereign gold bonds or gold ETFs. Not a directional bet — a structural risk management position. |
VI. THE CENTRAL QUESTION: BOUNCE OR BOTTOM?
The chart's own framing — 'temporarily bullish or minor bounce event' — is the correct way to approach this cluster, and it deserves a direct answer rather than a diplomatic one.
This is most likely a tactical bottom, not a secular bottom. The distinction matters. A tactical bottom produces a 7-15% recovery that is then followed by consolidation — price goes sideways for quarters, digesting overhangs from FII positioning, earnings uncertainty, and global macro volatility. A secular bottom (like March 2020 or November 2022) requires a clear, identifiable shift in the fundamental driver — policy pivot, earnings acceleration, or a global risk appetite restart. None of these are yet unambiguous.
The support cluster is where the bears lose momentum and the bulls regroup — it is not yet the moment where the bull market resumes. The correct posture is opportunistic, not euphoric.
Three conditions, if met simultaneously, would upgrade this from a tactical bounce to a durable low: (1) FII net buying in at least two consecutive months, (2) Q4 FY26 earnings showing margin expansion and positive revenue surprise, and (3) RBI delivering a second rate cut with a dovish forward guidance. Watch for these signals before increasing allocation materially above the initial entry.
Until those conditions are met, treat the cluster as a zone to build — not a signal to be fully deployed. The market that produces the strongest sustained rallies is the market that makes the most investors doubt the bottom before confirming it.
VII. RISK SCENARIOS AND MONITORING FRAMEWORK
Primary Risk: Cluster Failure
A sustained weekly close below the support cluster — defined as two consecutive weekly closes below the 200-DMA with declining DII participation — would signal cluster failure. In this scenario, the next significant support zone lies approximately 8-12% lower, corresponding to the 2022-2023 breakout zone. This would represent the most significant Indian equity correction since the COVID lows and would likely require a material negative catalyst (crude spike, US recession signal, geopolitical escalation) to execute.
Secondary Risk: Earnings Season Disappointment
India's Q4 FY2026 earnings season (April-May 2026) is the near-term binary event. Nifty 50 consensus earnings growth estimate for FY26 stands at approximately 12-14%. A miss on this number — particularly in banking (NIM compression), IT (weak US client spending), and consumer (volume decline) — would invalidate the valuation argument for buying at the cluster and compress targets by 5-8%.
Tail Risk: Crude Oil Spike
India's macro vulnerability to crude oil remains structurally unresolved. Every $10 per barrel increase in Brent crude widens India's current account deficit by approximately 0.4% of GDP, exerts downward pressure on the rupee, and imports inflation that constrains the RBI's easing space. Any geopolitical event in the Persian Gulf, Iranian Strait of Hormuz disruption, or OPEC+ supply cut that drives Brent above $90-95 per barrel would represent a macro negative of the first order for Indian equities — particularly for aviation, paints, tyres, and the broader consumption complex.
CONCLUSION: THE BUY SIDE VERDICT
The Nifty 50's arrival at the major support cluster is the most technically and fundamentally significant event in the Indian equity market since the September 2024 peak. The convergence of moving averages, Fibonacci levels, and prior structure creates a defensible entry zone — the kind that systematic funds and long-only institutional managers are paid to exploit with disciplined position-building.
The macro context is not yet uniformly supportive. FII flows remain negative, the earnings upgrade cycle has not begun, and global risk appetite is fragile. But the domestic structural bid — from SIPs, LIC, and government capex — provides a floor that did not exist in prior market cycles. India is a structurally different equity market in 2026 than it was in 2015 or 2018: deeper, better-capitalized domestically, and less dependent on FII flows for price direction.
Build at the cluster. Hedge intelligently. Reserve firepower. The market that confirms a bottom will do so only after making the maximum number of investors doubt it.
The tactical call is constructive — staged entry, defensive sector mix, gold hedge in place. The strategic call requires patience — the conditions for a new bull leg have not been met, but they are building. The support cluster is where that building begins.