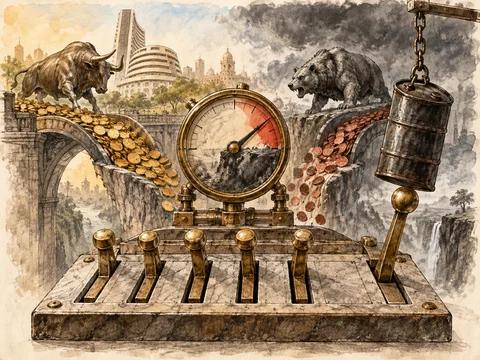
The 7 September 2026 report’s central insight survives the October refresh: an exchange-traded fund’s market price can move far more than the value of its underlying portfolio. Changes to the permitted trading range can amplify that gap when new unit supply is constrained. The gain on a trading screen is therefore not automatically the return earned by the assets inside the fund.
This is a dated event analysis, revised on 8 October 2026. The original broker snapshots are historical observations from the supplied report; they are not represented as today’s market prices. The important regulatory mechanism has now been checked against the official NSE implementation circular.
The rule change is supported by primary evidence
NSE circular CMTR76101, dated 1 September 2026, applies revised ETF trading parameters from 7 September. The base for price bands is the previous trading day’s closing market price, defined through the last 30 minutes’ volume-weighted price. It specifies fallbacks if that interval or the preceding day has no trading. For equity and relevant debt ETFs, the initial dynamic band is 10%, with 5-percentage-point expansions up to 20% after the required cooling-off. Liquid and overnight ETFs have a different fixed band; commodity ETFs have different dynamic parameters.
That distinction matters. A base linked to a market price can carry an existing premium into the next day’s allowable range. The rule permits a transaction within that range; it does not establish the fair value of the unit or require buyers to trade at the upper limit. The article’s explanation is a mechanism, not proof that every September price movement was caused exclusively by the circular.
The original market observations retain their timestamps
The source recorded MONQ50 at a ₹170.31 day high and a later ₹164.09 quote, against a previous NAV reference of ₹118.7371. Its later quote and high were different observations. They implied reference premiums of roughly 38.2% and 43.4%, respectively, when compared with that NAV. Those percentages are arithmetically correct but compare different timestamps; they are not exact same-minute executable premiums.
The original report also recorded MASPTOP50 and MAFANG snapshots at different times. This update does not combine those observations into a current cross-fund ranking. To make one, prices, fund values, currencies, underlying-market hours and available liquidity would need matched timestamps and an identified methodology.
A defensible event chart should preserve all of those dates and times. This edition instead uses a transparent illustration to explain the pricing mechanism, because a complete primary intraday price/NAV series was not recovered. Drawing a smooth historical premium line from a handful of snapshots would invent evidence.
Figure 01 · Conceptual framework
How unit creation can restrain a premium
How the parts connect
- ETF trades above basket valuearbitrage signalCreation channel available?
- Creation channel available?availableAcquire basket and create units
- Acquire basket and create unitssupply responseSell additional units
- Creation channel available?restrictedCreation constrained
- Creation constrainedlimited responsePremium persists or widens
How a premium can enter tomorrow’s price band
Assume the assets remain worth ₹100 per unit. Suppose the prior market close is ₹120. The next day’s initial 10% upper boundary is ₹132; a 15% boundary is ₹138; a 20% boundary is ₹144. The asset basket has not changed in this example. The permitted market premium has increased because the reference already contained a premium.
| Reference or threshold | Amount | Meaning |
|---|---|---|
| Constant illustrative asset value | ₹100 | Assumed economic basket value |
| Previous market close | ₹120 | Contains a 20% premium |
| Initial upper band | ₹132 | Prior close×1.10 |
| Expanded upper band | ₹138 | Prior close×1.15 |
| Further expanded upper band | ₹144 | Prior close×1.20 |
The table describes available trading space. Actual orders, matching and liquidity determine where a transaction occurs. A price band is not a valuation endorsement, guaranteed liquidity or a promise that the unit can always be sold at the displayed price.
Creation and redemption normally connect price to value
The basic arbitrage mechanism is a supply response. When eligible participants can obtain assets, create ETF units and sell them, an excessive premium can attract new supply. When units trade sufficiently below the value obtainable through redemption, the opposite process can reduce supply. Trading costs, execution delays and risk prevent this relationship from being frictionless.
For an overseas fund, the usable creation channel can depend on fund-specific subscription arrangements, overseas investment headroom, settlement, currency conversion and underlying-market access. The original source discussed these constraints as a reason existing units could trade at a persistent premium. This update has not verified each named fund’s October creation capacity and does not state that every named scheme remained closed or constrained on 8 October.
The diagnostic sequence is straightforward: establish the current fund notice, identify who can create or redeem and in what size, calculate the full creation economics, and compare them with available exchange liquidity. A generic statement that ETFs always trade close to NAV is unsafe when the mechanism connecting them is impaired.
Figure 02 · Conceptual framework
A price band can inherit an existing premium
How the parts connect
- Market close with premiumsets referenceNext session’s reference
- Next session’s referencesets boundariesPermitted trading range
- Underlying asset valueportfolio benchmarkInvestor comparison
- Permitted trading rangeallowed range is not valueInvestor comparison
Asset return and premium return are separate
Write market price as asset value multiplied by one plus the premium. If asset value changes from N 0 toN 1 and the premium changes from p₀ to p₁, the gross investor return is:
This identity makes the risk visible. A positive underlying return can be outweighed by a falling premium. Starting with ₹100 of assets at a 40% premium means paying ₹140. If the assets later rise 10% but the premium disappears, sale value is ₹110 and the return is −21.43% before costs. If assets remain flat and the premium disappears, the loss is 28.57%. If assets rise 10% and the 40% premium survives, sale value is ₹154 and the return is 10%.
| Illustrative exit | Sale value | Return on ₹140 entry |
|---|---|---|
| Assets unchanged; no premium | ₹100 | −28.57% |
| Assets up 10%; no premium | ₹110 | −21.43% |
| Assets up 10%; 40% premium remains | ₹154 | +10.00% |
These are scenarios, not forecasts. A premium can widen, persist or disappear. Buying after a fall from an upper-limit price does not establish that the remaining premium is small.
Price discovery and investor protection
Market-price bands manage the permissible trading range; disclosure and unit creation address different parts of market quality. A well-designed investor interface should make the fund’s latest value estimate, its timestamp, the price-to-value gap and any creation restrictions visible together. An outdated value should not acquire false precision merely because it appears next to a live price.
For a fund of funds, inspect the holdings and valuation method. If it holds ETF units valued at exchange prices, some of the premium may be embedded in its own NAV. Buying a wrapper does not necessarily remove the economic exposure to that premium. Conversely, one cannot assume identical treatment across every fund without reading its documents.
Limit orders can control the price a participant accepts but cannot guarantee execution. A circuit limit, thin order book or absent counterparty can prevent an exit. An apparent arbitrage is not automatically implementable for a retail holder who lacks unit creation/redemption access or securities-borrowing capacity.
Figure 03 · Qualitative comparison
Portfolio return and premium return are separate
| Portfolio value | Premium | Possible investor outcome |
|---|---|---|
| Rises | Unchanged | Price rises with portfolio value, before costs |
| Unchanged | Widens | Price rises without an underlying asset gain |
| Rises | Narrows | Premium compression can offset portfolio gains |
| Falls | Widens | The premium can mask some underlying losses |
What would change the interpretation
A proper follow-up needs a dated premium series, fund-level creation notices, units outstanding, trading volume and bid–ask depth. It should compare value estimates on consistent timestamps, then separate underlying return, currency return and premium movement. An event study would also need a counterfactual; one striking trading day cannot establish the market-wide causal effect of a rule.
The original report referred to a future change in the reference framework in 2027. This edition does not present a future schedule as an already effective rule; later implementation documents must control. Its current verified anchor is the September NSE circular.
The continuing lesson for India’s market structure is precise: overseas exposure and the price paid for access to that exposure are separate decisions. The source’s September event remains useful because it shows how trading rules, demand and the unit-supply mechanism can interact. The article’s current conclusion is about that interaction, not an instruction to trade at an unverified October quote.
Source record and update scope
National Stock Exchange of India — ETF price-band base and dynamic bands effective September 7; relevant ETF categories distinguished. Observation/publication: 2026-09-01. Verified primary source; observed date stated.
SEBI — June 15 SEBI circular title/date identified; future implementation not asserted without effective instrument. Observation/publication: 2026-06-15. Verified primary source; observed date stated.