Original Lens and publication context
A US law can tax India's goods at up to 100%. France offers help on the sea route India would need to quit Russian crude. At stake: a $1bn discount, a $23bn tariff, a $45bn route.
- Two capitals are working one lever: a US law can tax India's goods for buying Russian oil, and France is offering to help secure the sea route India would need to quit it.
- Russia has already taken most of its discount back: from $12 a barrel in February to about $1, worth about $1.0bn a year.
- The tariff risk is large: up to $22.9bn a year of lost export sales at 100%, about 0.6% of GDP.
- The route is larger still: a reopened Hormuz is worth up to $45.3bn a year to India, over 40 times the discount.
- On our weights the tariff costs $8.4bn a year and the route pays $11.2bn, so India has more room than it looks.
HOW THE SQUEEZE IS SHAPING UP Now · five days, four moves 18 Sep: US tariff law, up to 100%. 21 Sep: France asks India to work on safe passage through Hormuz and Bab el-Mandeb; the two Presidents meet. 22 Sep: a joint UN draft for a Hormuz mission. What might happen · by about 18 October The US offers China six more months, to May 2027. India may be named. Ladder: waiver with a cap, 25–50%, 100%, then sanctions. Why the US · why France India pays Russia about $68bn a year, up from $23bn in February (C10). France has bases beside both gates and 29% of India's arms. The US brings the stick; France brings the road. What nobody knows April's models had world oil stocks at their floor by September. They missed by 1,140 million barrels (C13). Nobody can call the oil price, so we price outcomes. If it happens · the maths Worst: −$22.9bn a year, 0.57% of GDP. Best: +$30.4bn, 0.76%. Weighted net: +$2.8bn (C11). |
2.08 mb/d Russian crude into India August, 45% of imports. About 1.9 mb/d in September. [OBSERVED] | $12 → $1 The discount Russia took back How far below Brent Russian crude landed. February against September cargoes. [OBSERVED] | 12 mb/d Oil still crossing Hormuz Mid-September, strait plus bypasses. 21 before the war. 7.5 of it dark. [OBSERVED] | $48bn Exports in the line of fire 55% × $87.3bn of goods sent to the US in FY26. [MODELLED · C4] |
I. Trigger
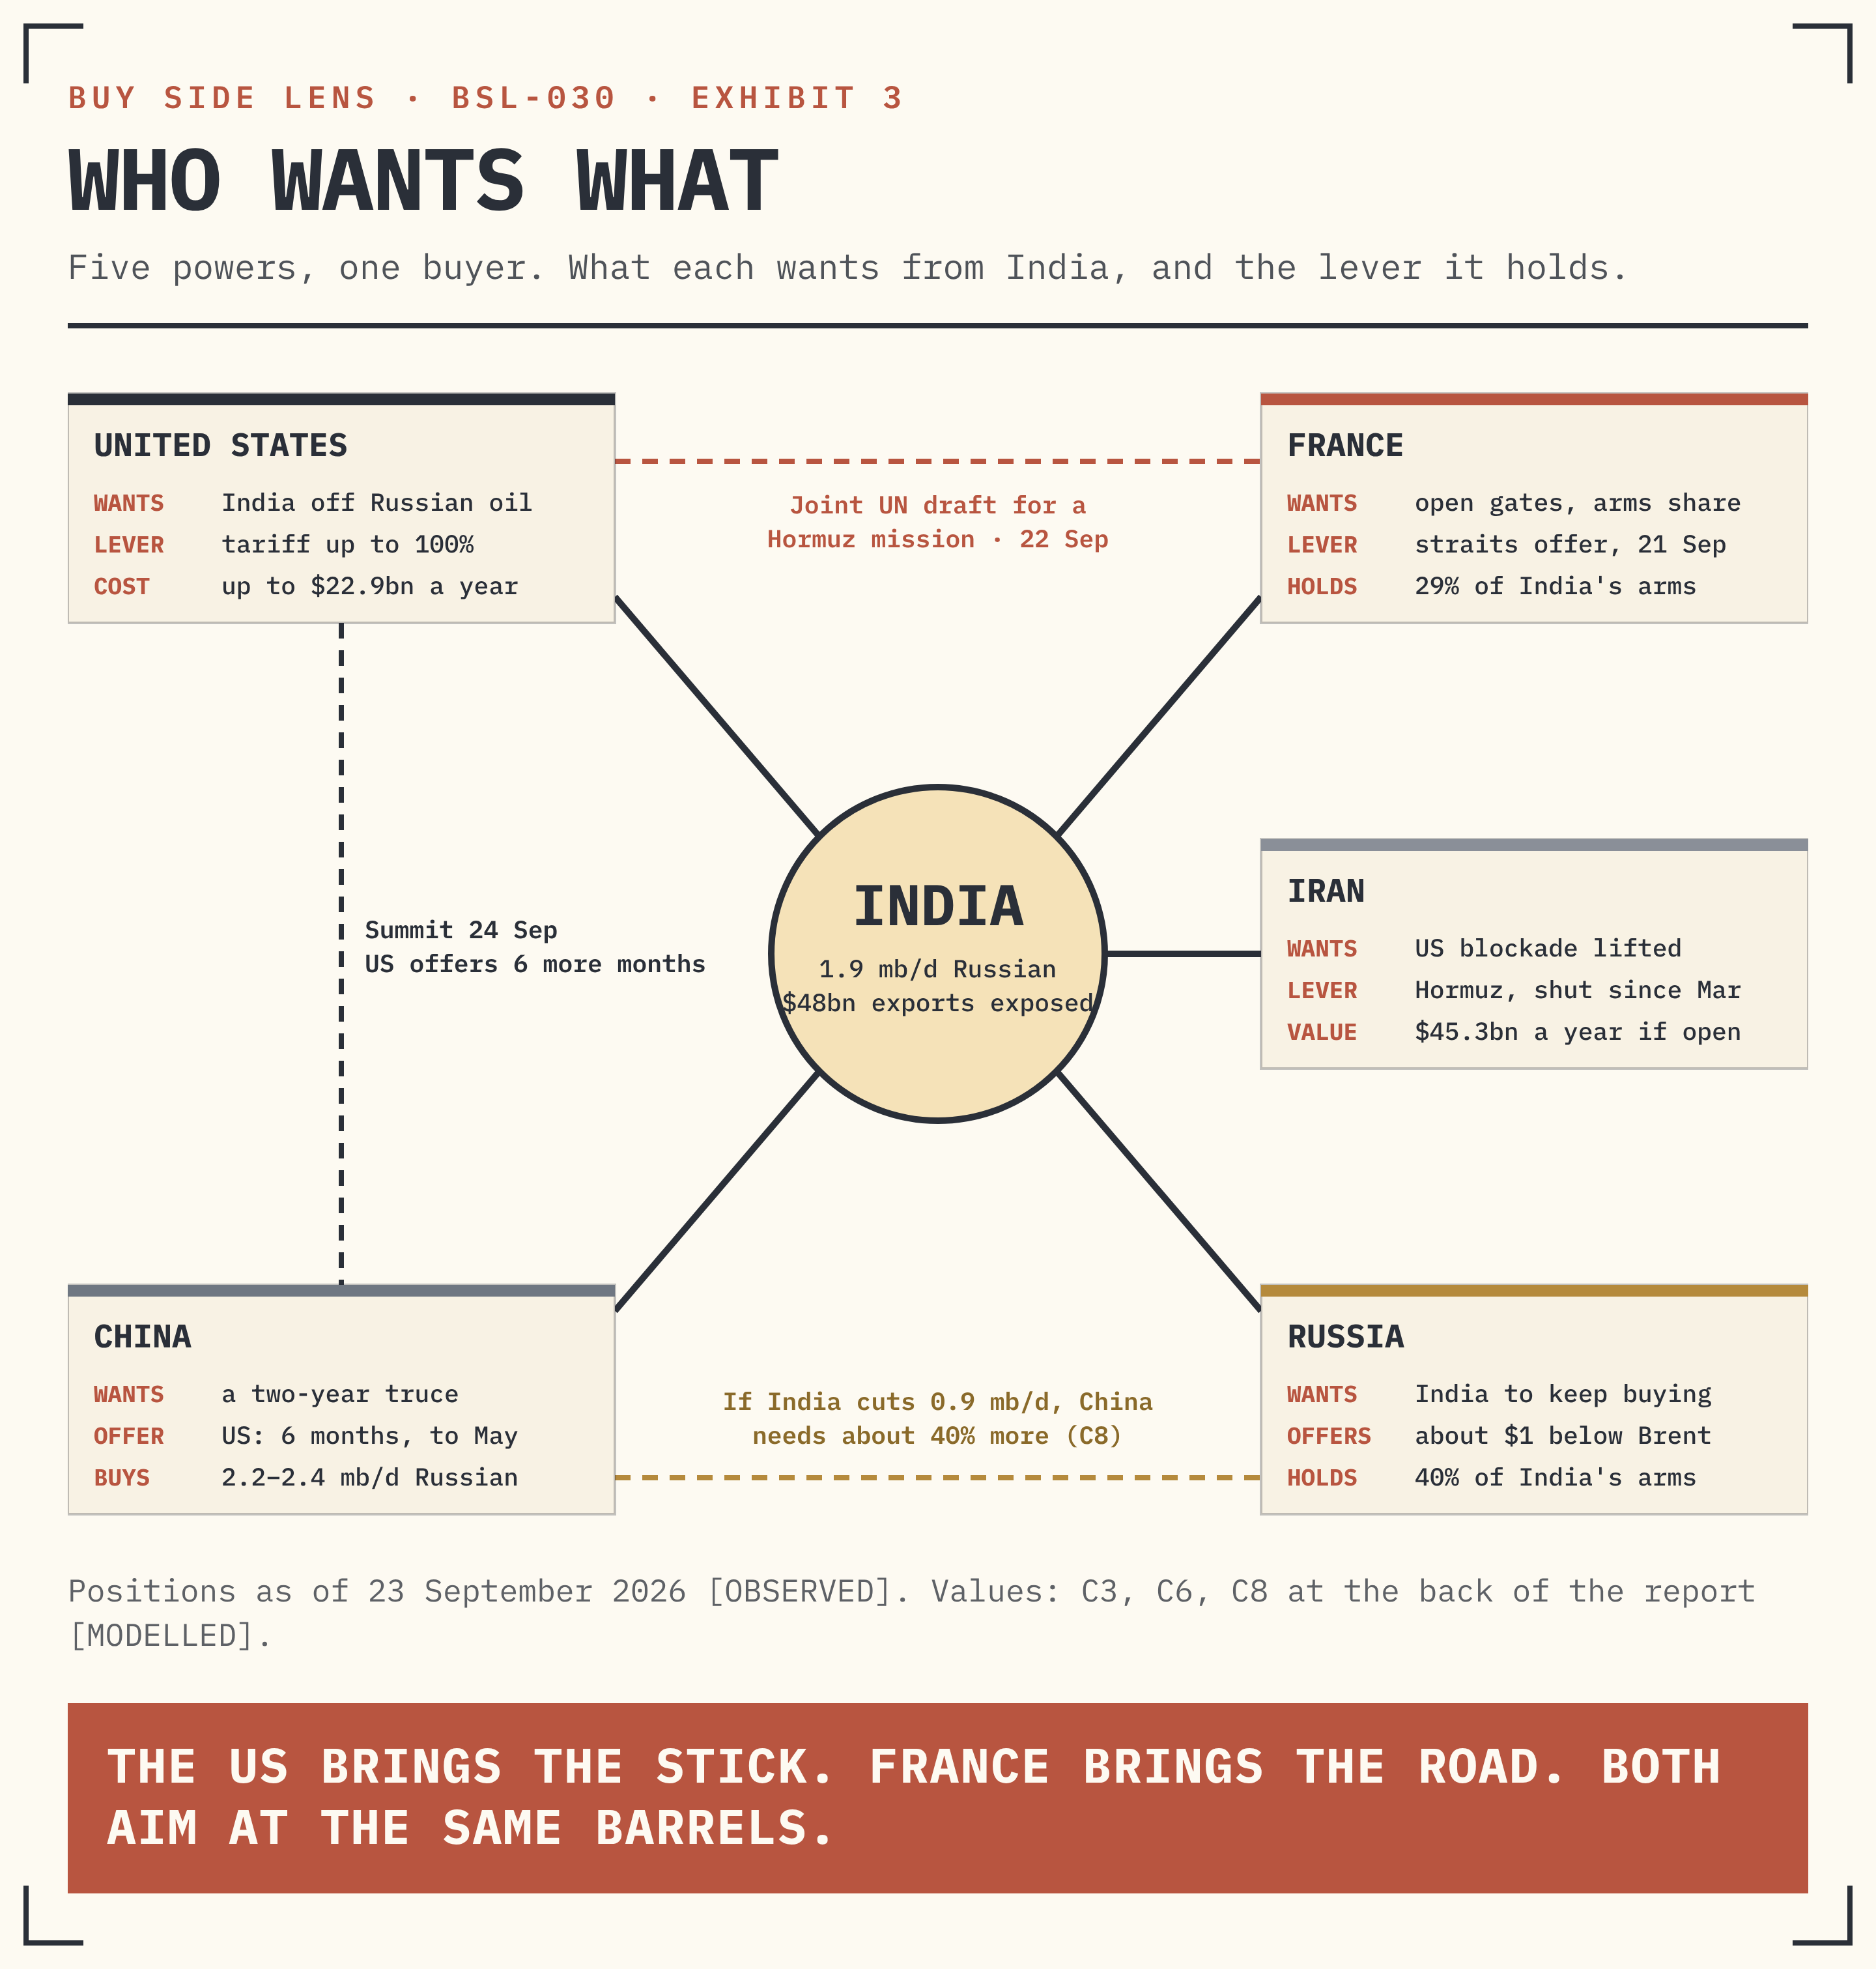
Two capitals, one squeeze: the US brings the tariff, France brings the route.
What happened between 18 and 23 September, and why we read it as one move.
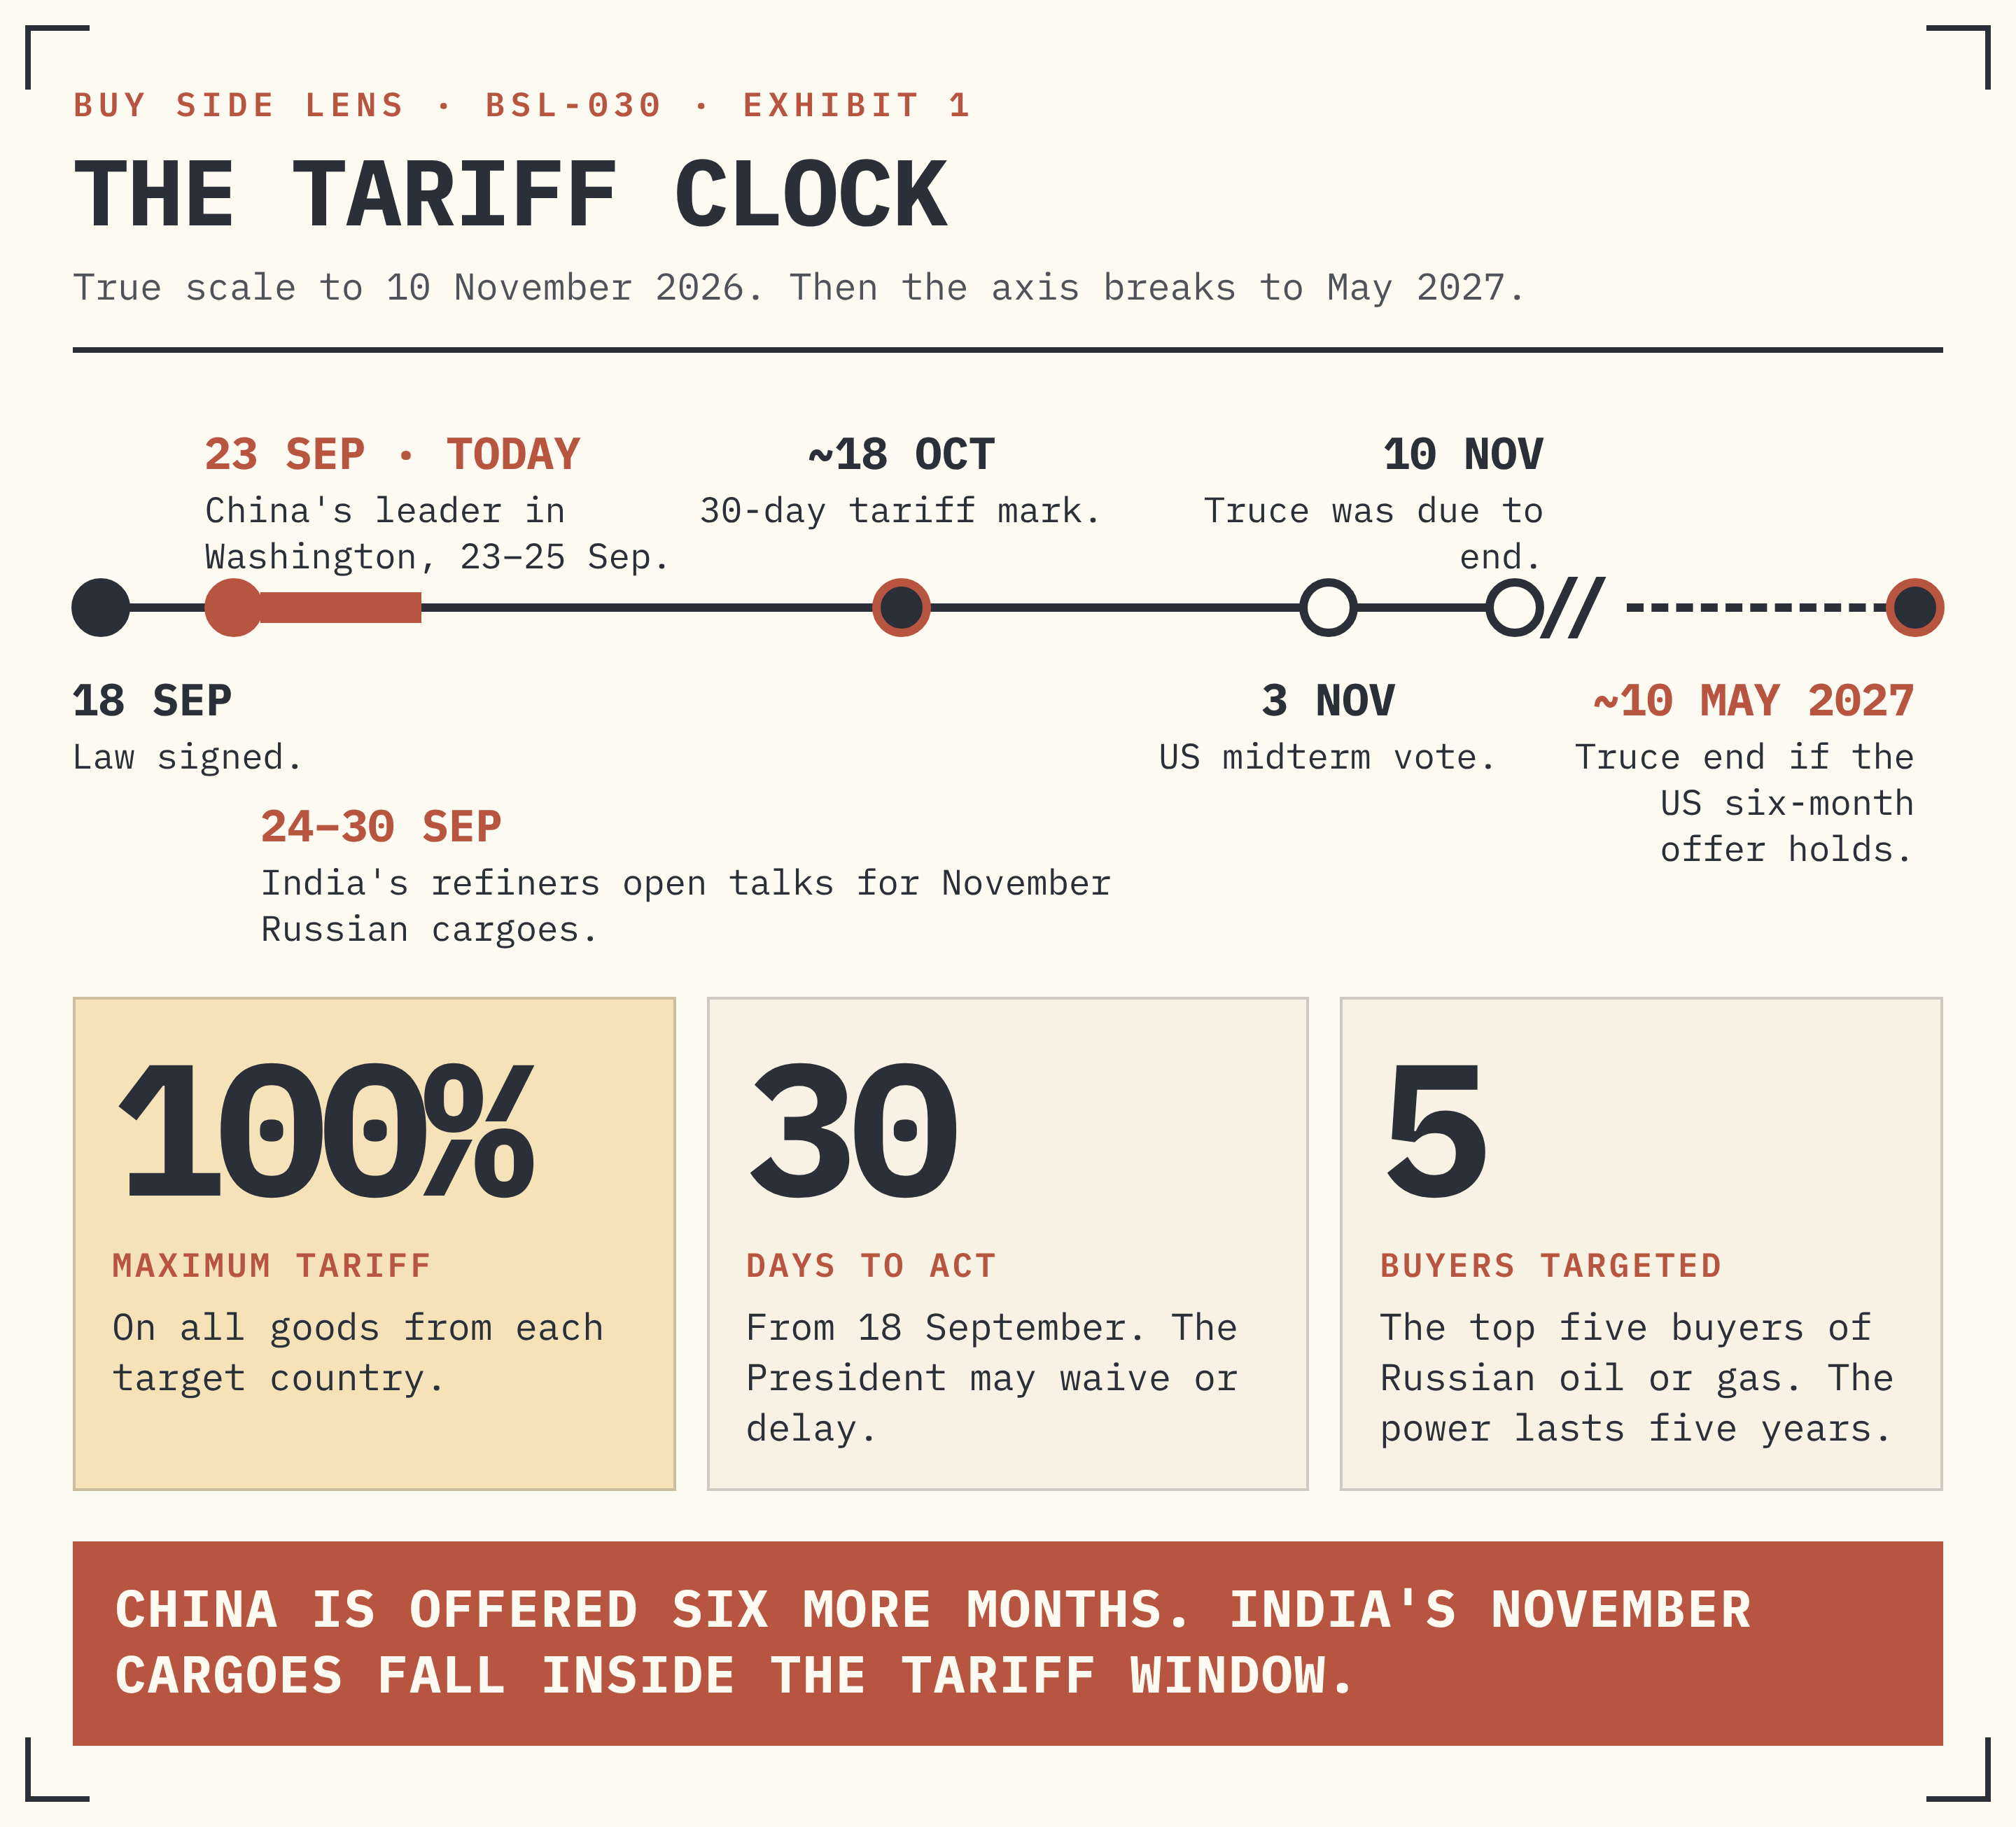
On 18 September the US signed a new sanctions law. It lets the President tax goods from the five biggest buyers of Russian oil or gas. A tariff is a tax on goods entering a country. The rate can reach 100%, within 30 days. The President can waive or delay it. The power lasts five years. The Senate passed it 86 to 11, the House 262 to 159. [OBSERVED]
- India. Refiners open talks for November Russian cargoes in the last week of September, inside the 30-day window. The biggest have begun to look for other crude. [OBSERVED]
- France. Its foreign minister pointed India to a French–British plan for Hormuz. The UN draft would set up an international mission to restore traffic, kept apart from the wider fight with Iran. [OBSERVED]
- China. The US–China truce was due to end on 10 November. China asked for two more years; the US has offered six months, to about 10 May 2027. China buys more Russian crude than India: about 2.2 to 2.4 mb/d. [OBSERVED]
- Iran. An Iranian official says Hormuz could reopen within seven days if the US ends its blockade. The US President says a deal could follow the 3 November vote. Pakistan carries messages between the two. [OBSERVED]
Supplied archive exhibit · original publication context.
Why Washington is pushing now.
- Russia's windfall. Russian crude landed in India near $61 a barrel in February. Today it lands near $97.50. India's payments to Russia rose from about $23bn a year to about $68bn. [MODELLED · C10]
- The tool came back. In February the US Supreme Court struck down the emergency tariff powers. The new law restores the tool by statute, a law passed by Congress, for five years. [OBSERVED]
- The China gap. Six more months of truce would likely spare China until May 2027. India becomes the biggest buyer left in view. The US gains from India as a balance to China. Now it may want more: less Russian oil, a place in a Western Hormuz mission, more Western arms.
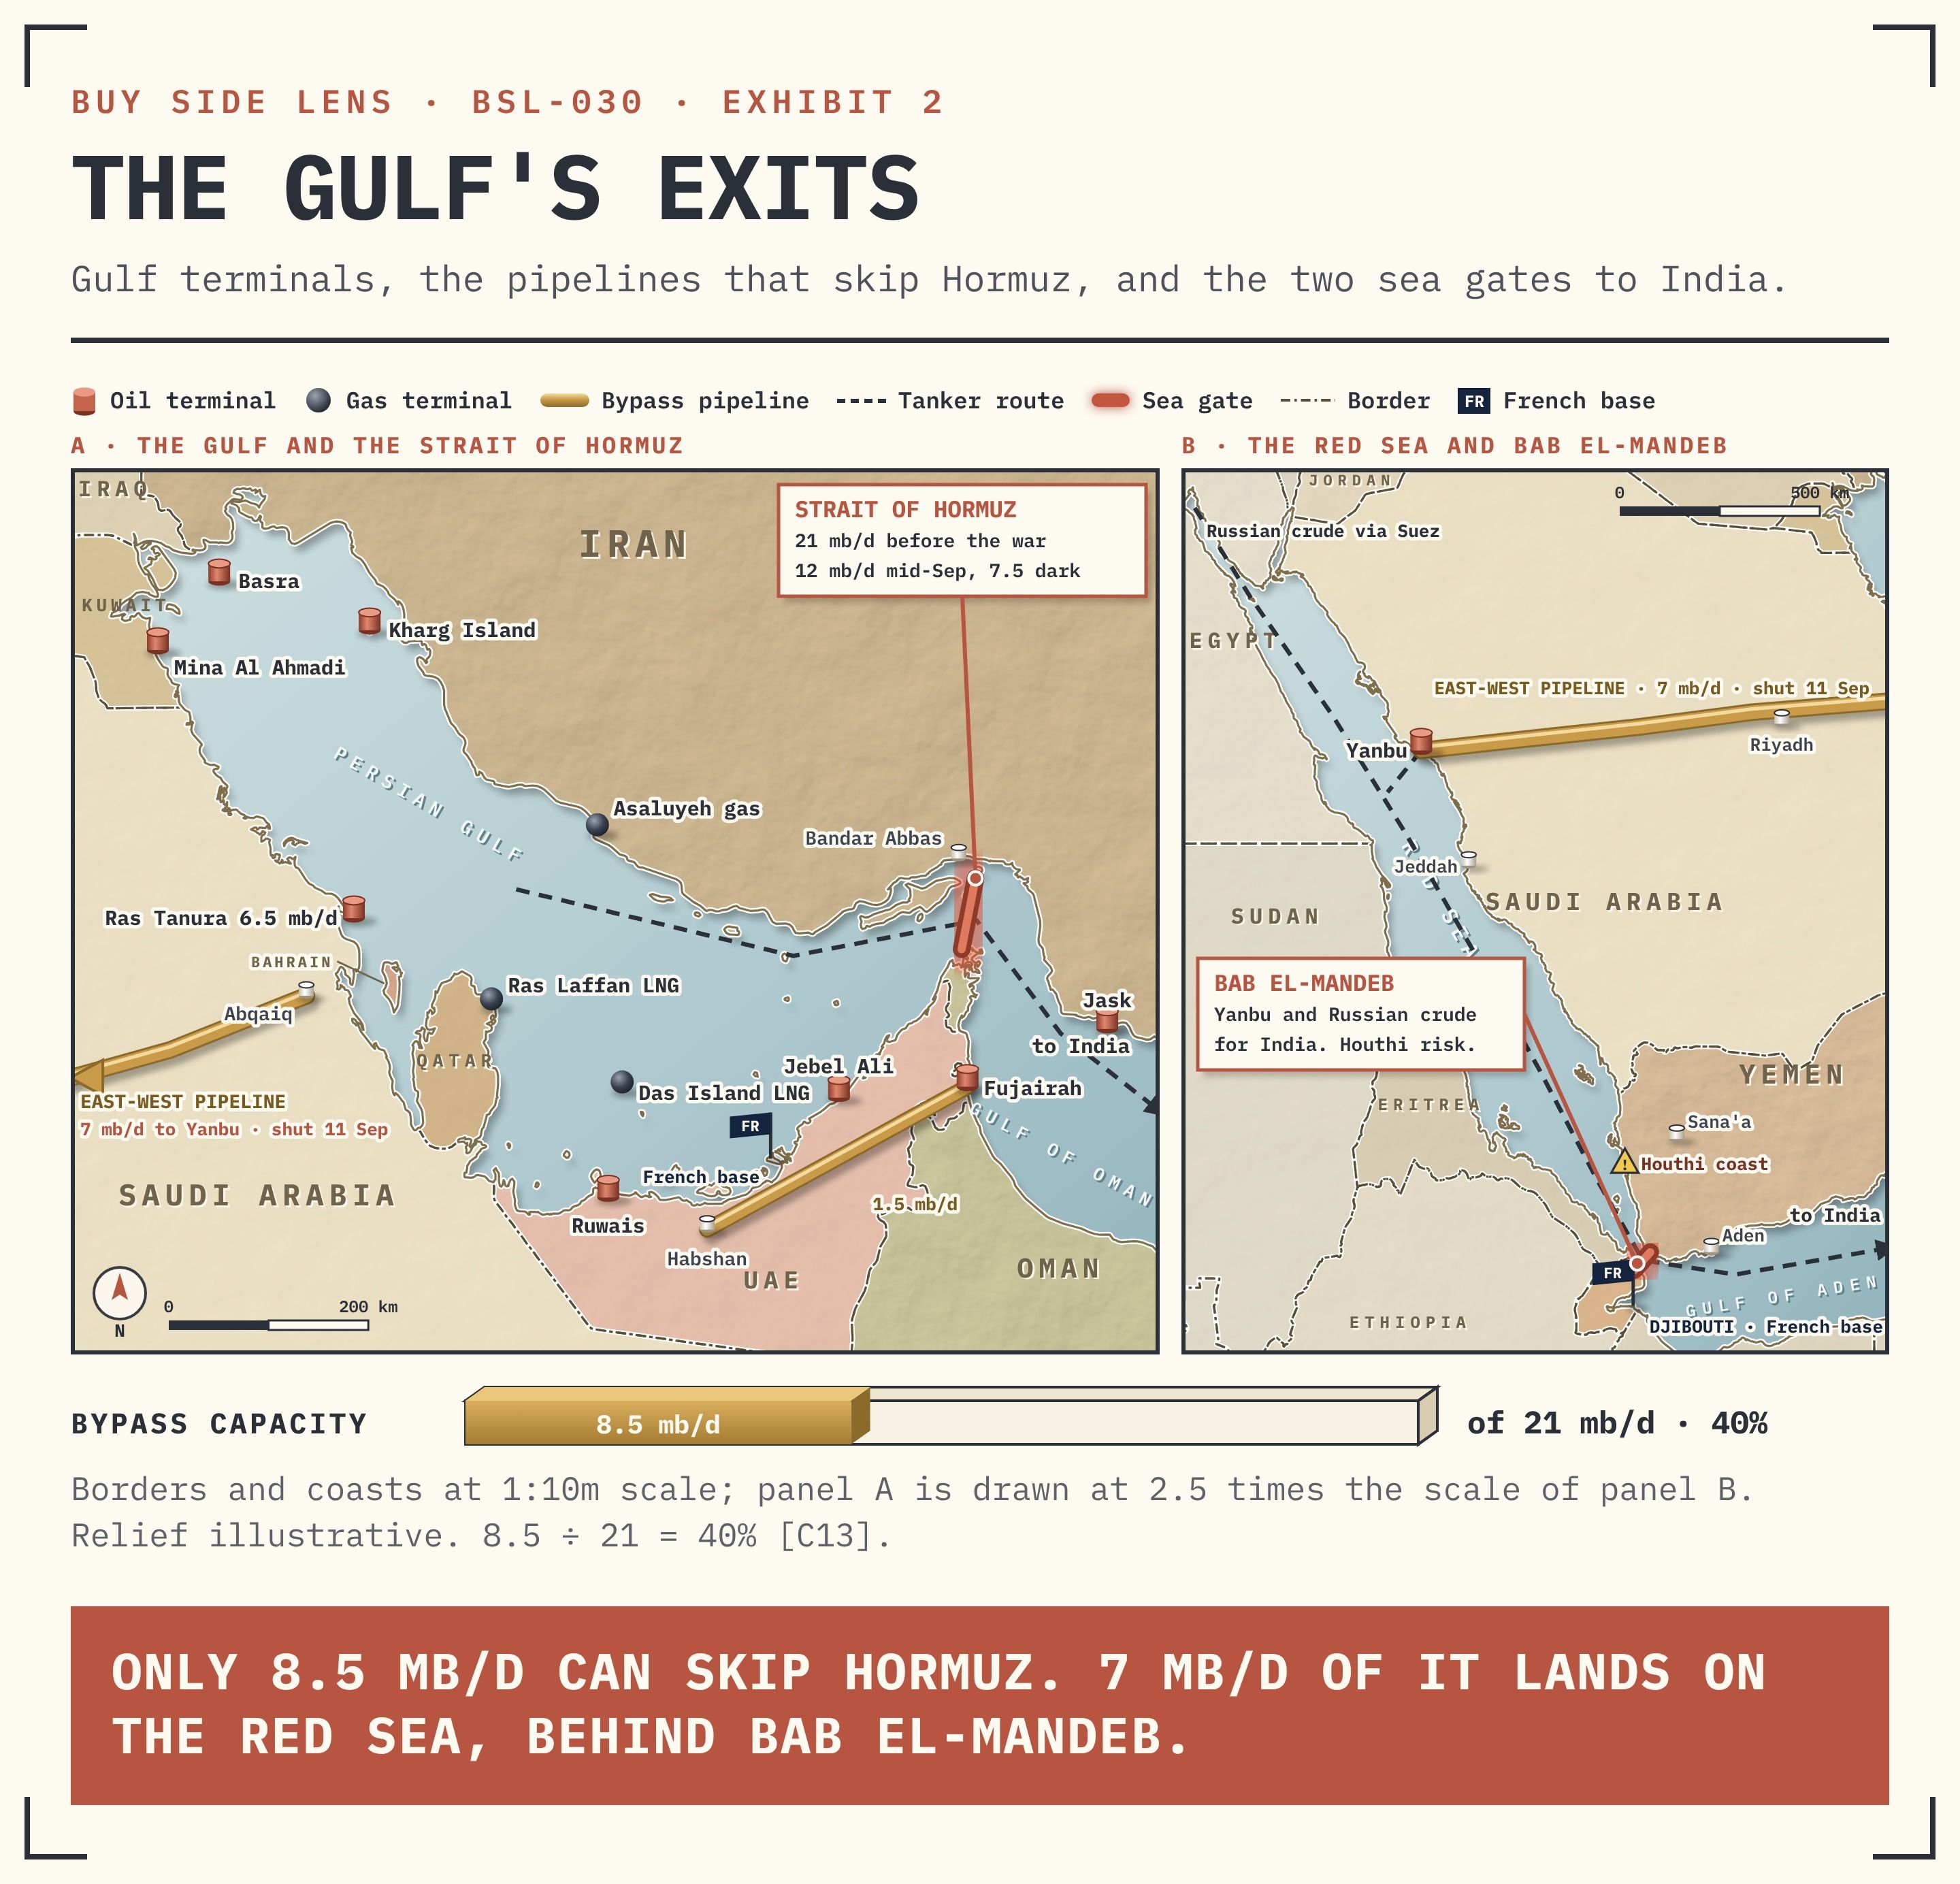
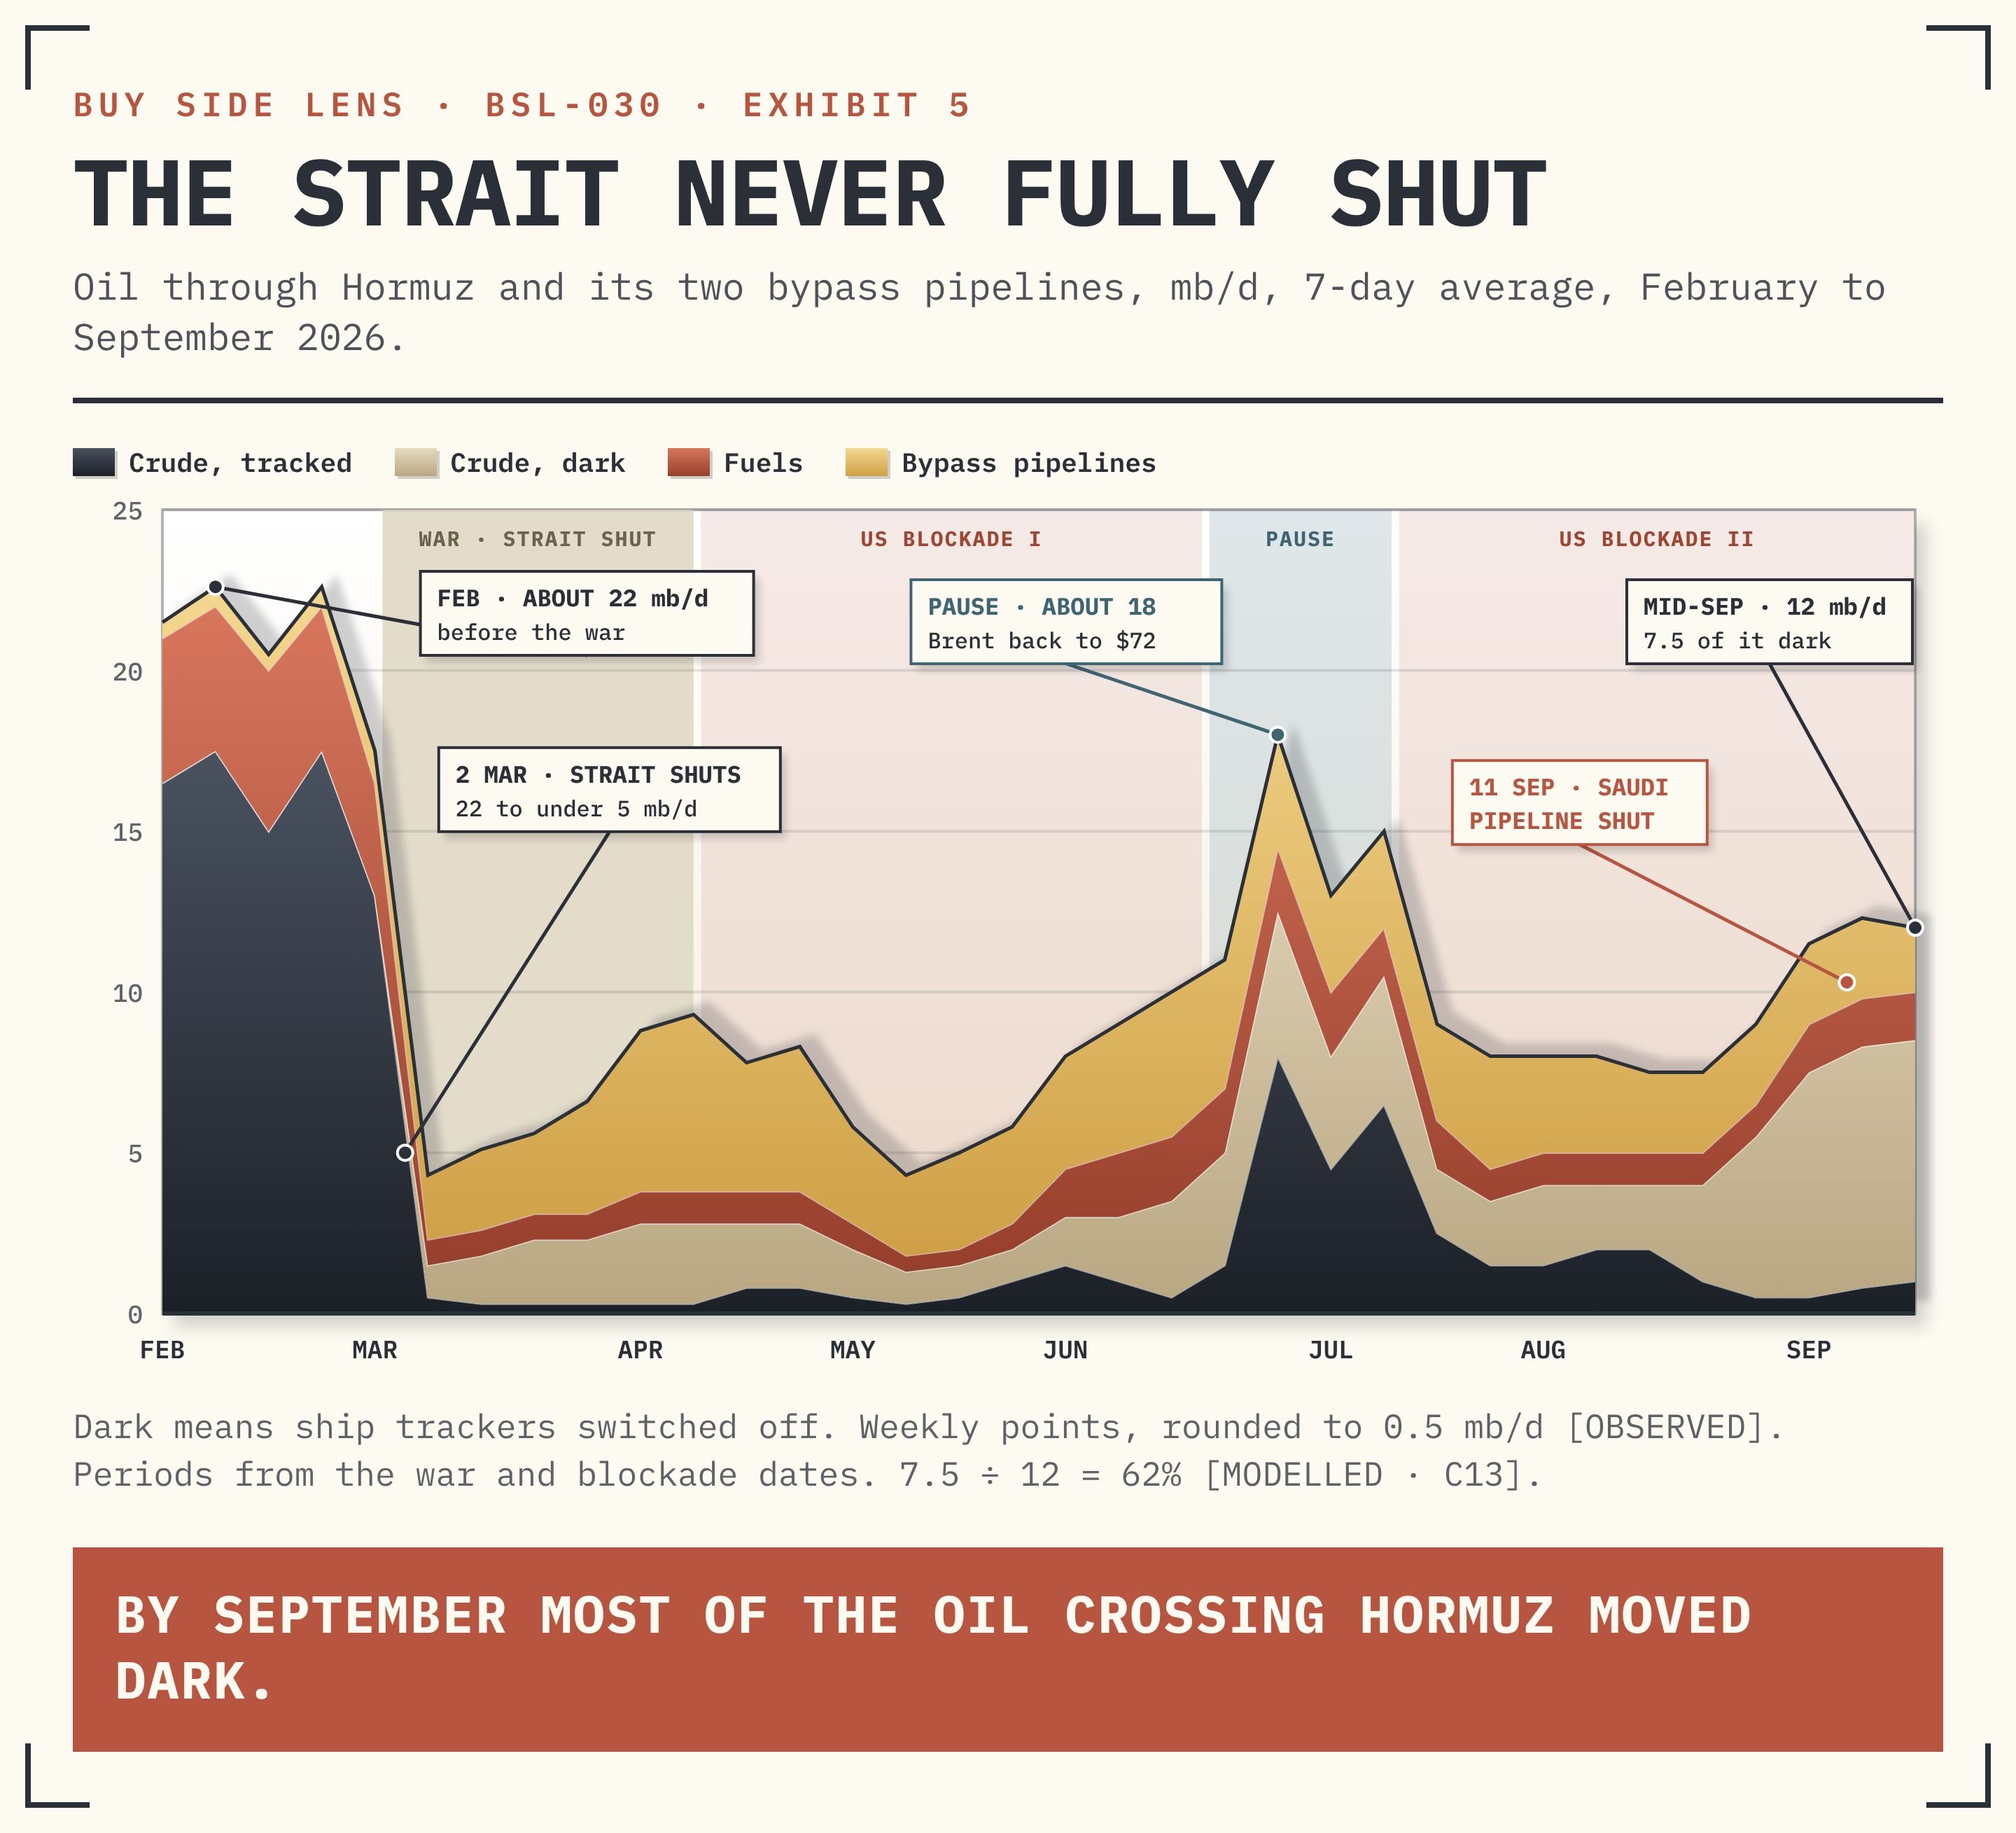
The Gulf's exits. Before the war about 21 mb/d of oil crossed Hormuz, a fifth of the world's supply. Iraq's Basra terminals, Kuwait, Qatar and Iran's main terminal at Kharg all load inside the strait. So does Saudi Arabia's Ras Tanura, which loads 6.5 mb/d. Only two pipelines skip it: Saudi Arabia's East-West line to Yanbu on the Red Sea, 7 mb/d, and the UAE's line to Fujairah, 1.5 mb/d. Together that is 8.5 mb/d, about 40% of the pre-war flow. [OBSERVED · C13]
The Saudi line shut on 11 September. Yanbu's oil must still sail south through Bab el-Mandeb, as most Russian crude for India does. So a plan for Hormuz alone is not enough. That is why France named both gates. In February, 59% of India's crude came from the Gulf. [OBSERVED]
Supplied archive exhibit · original publication context.
Why France stands with Washington. France often goes its own way. Here it moves in step.
- The gates. France keeps bases beside both: Djibouti on Bab el-Mandeb, Abu Dhabi near Hormuz. Europe's Hormuz sea-watch mission runs from the Abu Dhabi base. French ships already guard merchant ships from Houthi attacks. [OBSERVED]
- The arms seat. Russia supplies 40% of India's arms imports; France 29%. India buys 24% of all French arms exports, with up to 140 French combat aircraft on order. [OBSERVED]
- The war. Russian oil money pays for the war in Ukraine. On 21 September both ministers backed a ceasefire. [OBSERVED]
France never sanctioned India, even after the 1998 nuclear tests. An offer from Paris lands better in Delhi. The US brings the stick. France brings the road.
How it fits. The US holds the threat. France offers the second route. China is offered six more months. Russia's discount is thin. Iran holds the gate. India has seen this shape before: in 2019 the US ended its Iran waivers, the Gulf had spare oil, and India cut Iranian crude to zero within weeks.
The US does not need France to tax India. It needs France to give India somewhere to go.
What India weighs. A Western mission has costs prices do not show. Russia could lean closer to China. India's neutral name in the Global South could suffer. And the 2017 US law against buying Russian arms stays a second lever.
Supplied archive exhibit · original publication context.
II. Flow
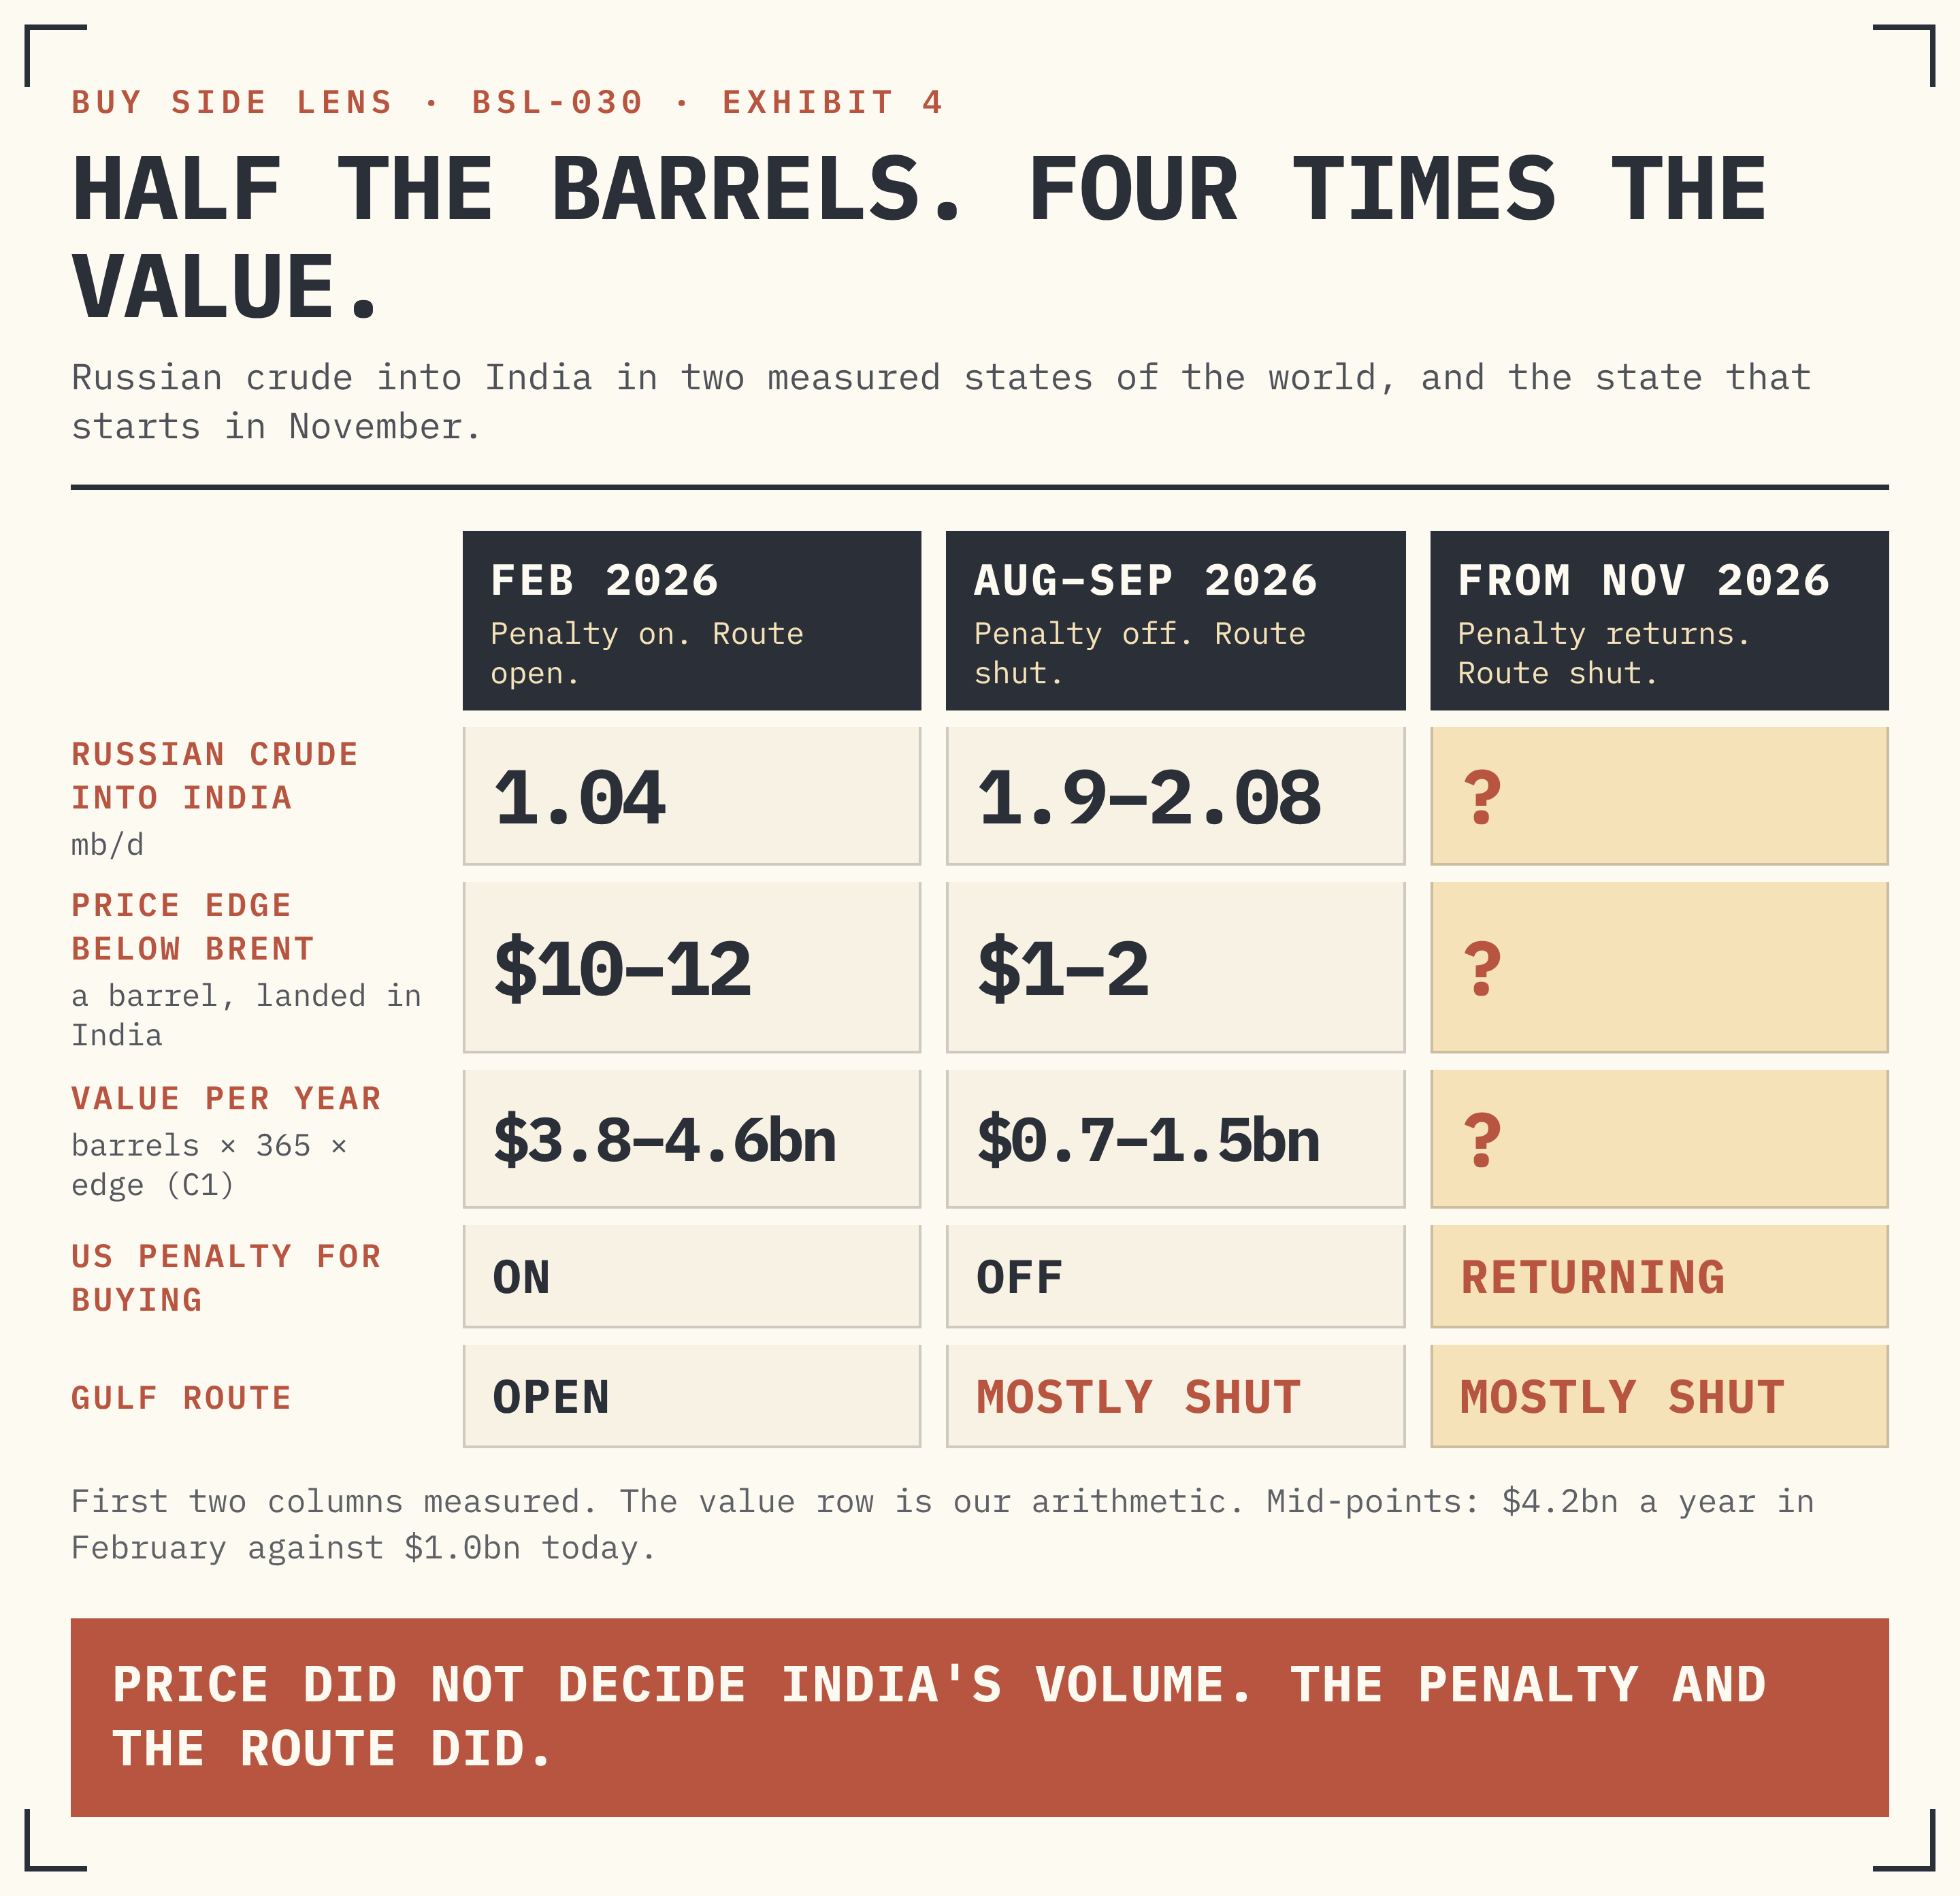
In 2026, the route decided how much Russian oil India bought.
Barrels, price edges and the strait, month by month.
Before 2022 Russia sold India almost no crude. By 2024 its share was 36%; in 2025, 33%. Then two switches flipped. [OBSERVED]
Switch one: the US penalty. From 27 August 2025 the US taxed Indian goods an extra 25% for buying Russian oil. From 21 November it sanctioned Russia's two biggest oil firms. Russian crude into India fell to 1.04 mb/d in February. The extra 25% went on 2 February.
Switch two: the Gulf route. War shut Hormuz from 2 March. Russian crude into India set records: 2.73 mb/d in June and 2.79 mb/d in July, over half of imports. August was 2.08 mb/d, or 45%.
Month | Russian crude into India | Share of crude imports | Russian crude against Brent, landed in India |
|---|---|---|---|
Dec 2025 | 1.38 mb/d | 27.4% | $6–7 below (January loadings) |
Jan 2026 | 1.09 mb/d | 21.2% | About $10 below (February cargoes) |
Feb 2026 | 1.04 mb/d | – | $12 below (27 February), the widest of the year |
Mar 2026 | – | – | $6 above (19 March), a record premium |
Jun 2026 | 2.73 mb/d | over half | – |
Jul 2026 | 2.79 mb/d | over half | Over $10 below (early July) |
Aug 2026 | 2.08 mb/d | 45% | $1–2 below (September cargoes) |
Sep 2026 | about 1.9 mb/d | – | Up to $1 above (October cargoes offered) |
All figures [OBSERVED]. Volumes are arrivals in the month. Each price edge is dated by the cargoes it prices.
Supplied archive exhibit · original publication context.
Russia paid India the most to stay when India bought the least.
The strait never fully shut. Oil through Hormuz and its two bypasses fell from about 22 mb/d in February to under 5 mb/d in early March. In the pause between the two US blockades, late June to mid-July, it jumped to about 18 mb/d. Brent fell to about $72 by 1 July, and the Russian edge widened past $10 again. By mid-September flows were back near 12 mb/d. About 7.5 mb/d of that crossed dark, with ship trackers switched off. [OBSERVED]
Supplied archive exhibit · original publication context.
III. Risk
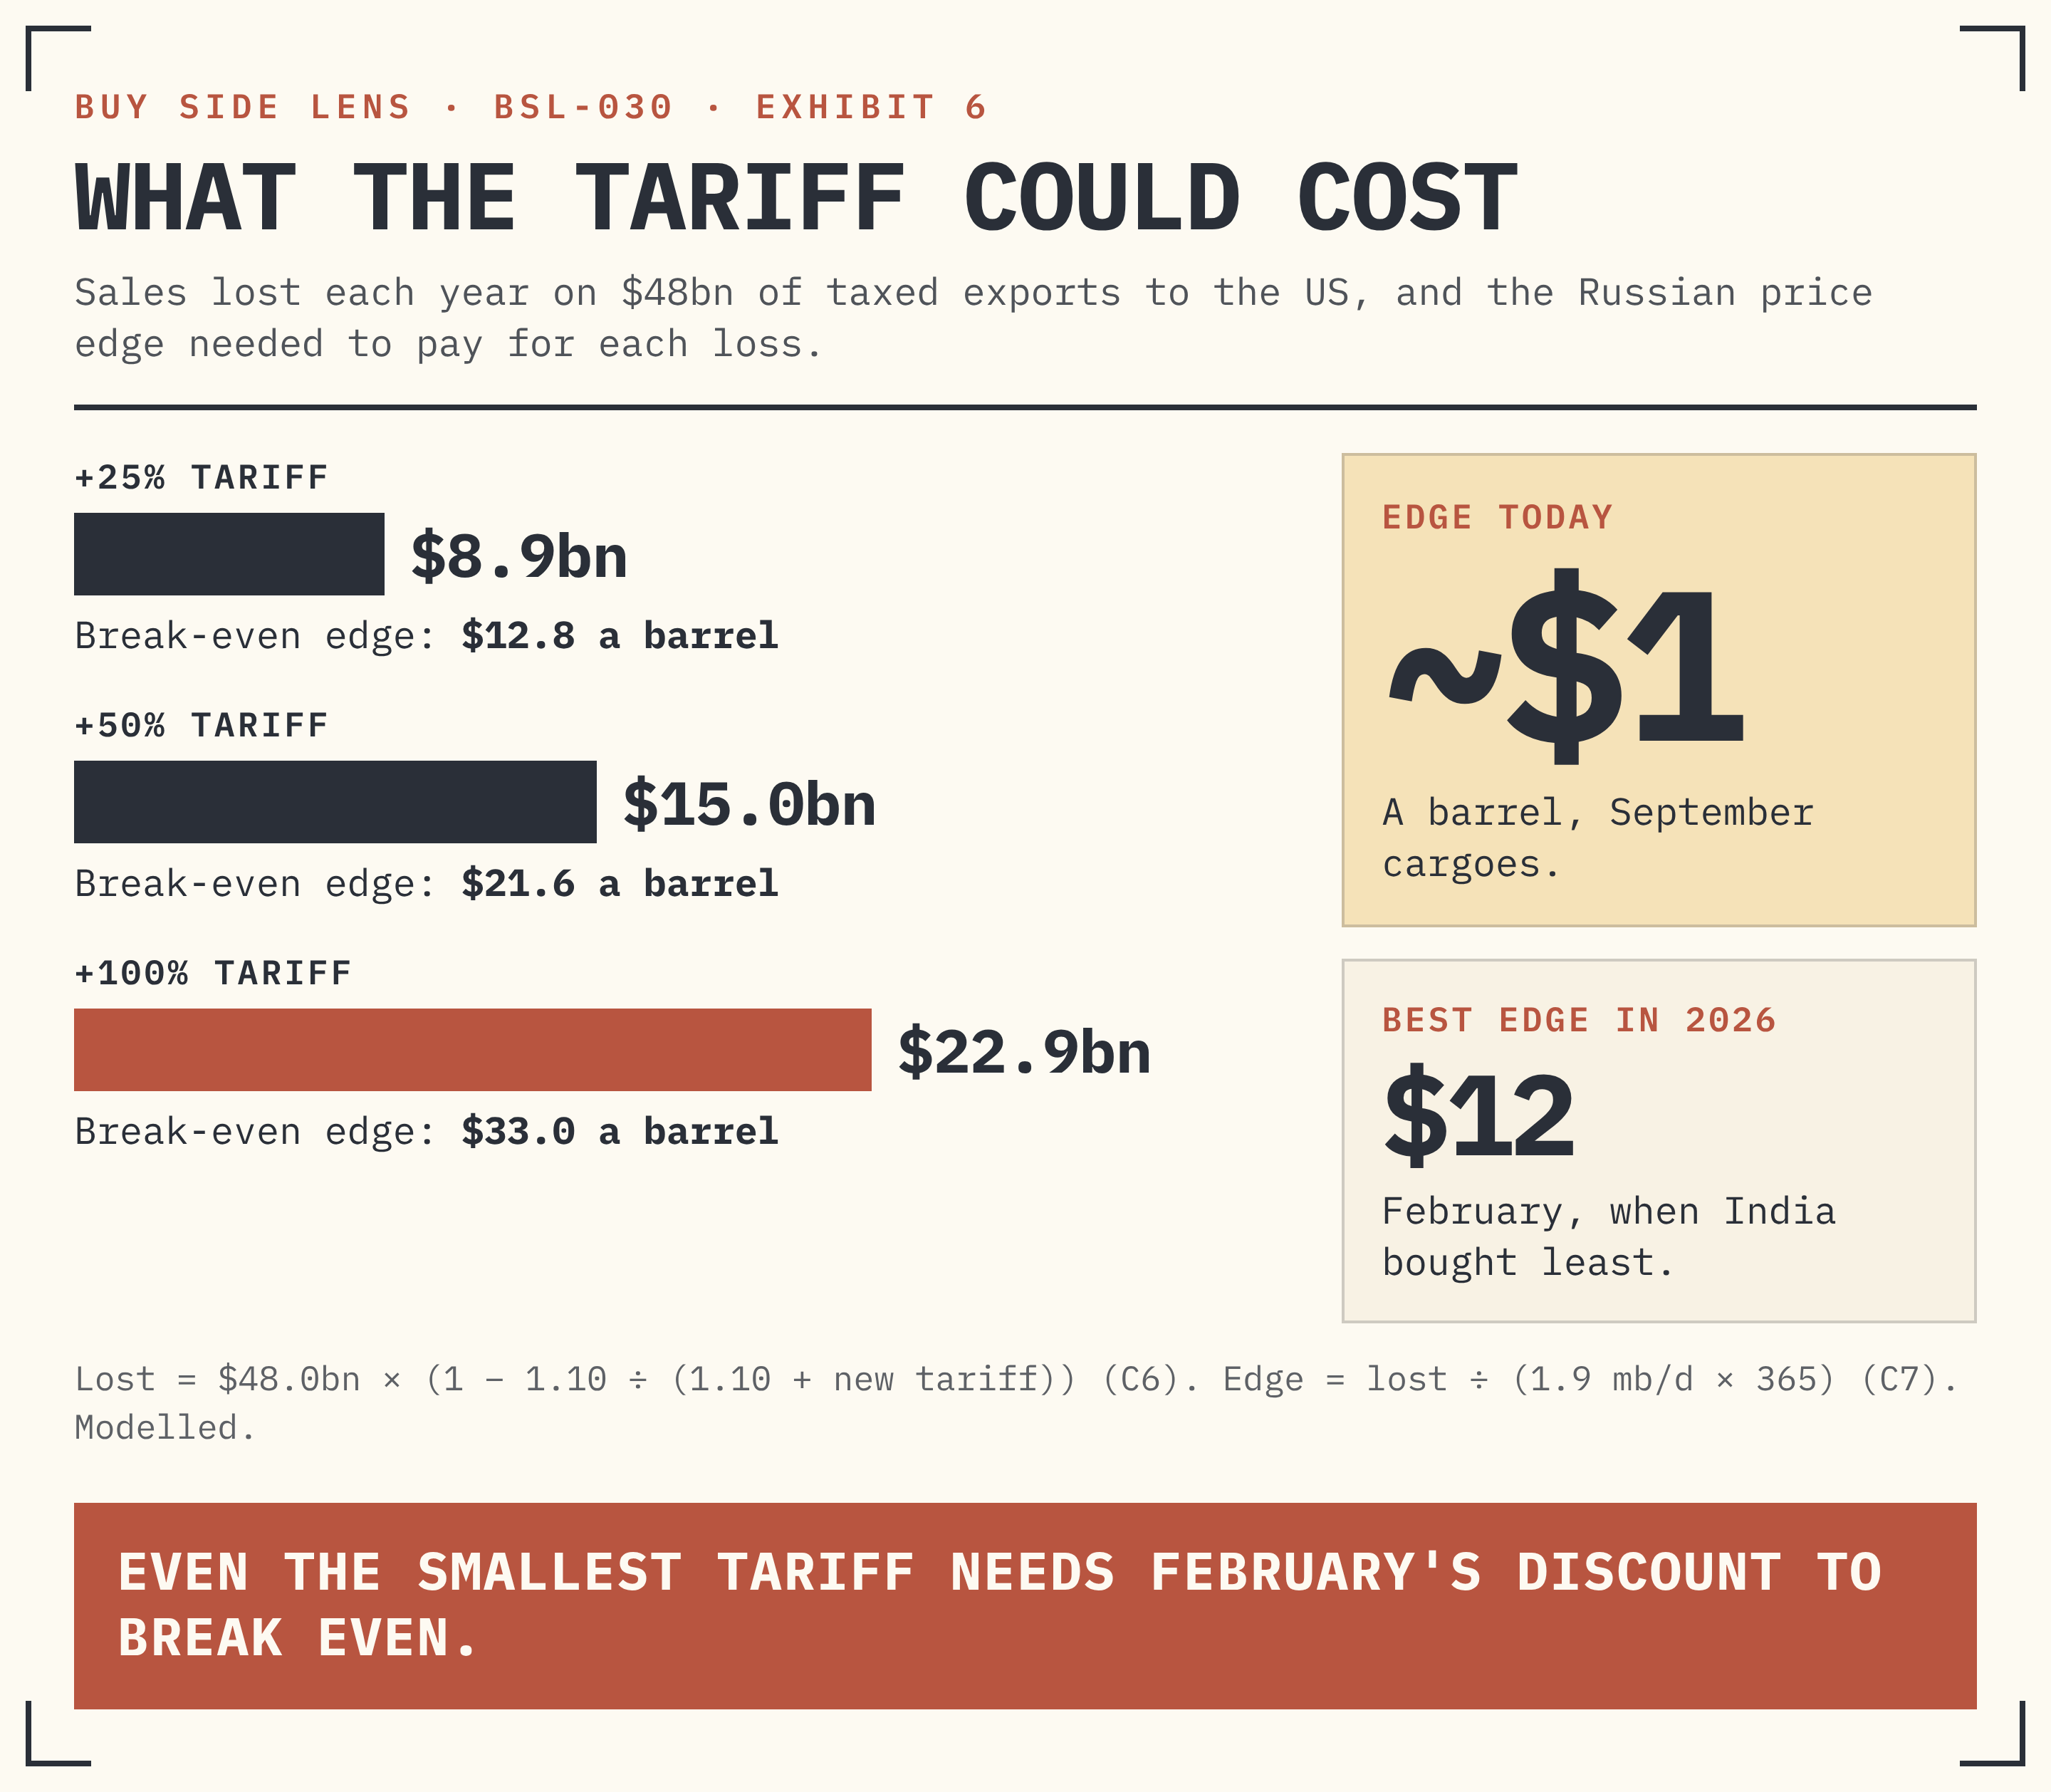
At 100%, the tariff risk is over 20 times the discount.
The alarm first. Then its size.
India sent $87.3bn of goods to the US in FY26. A 100% tariff would double their price at the US border. Many Indian sellers would be priced out. [OBSERVED]
Now the size. Not every good gets taxed. In 2025, phones, electronics, medicines and energy were spared. About 55% of sales were taxed. That is 0.55 × $87.31bn = $48.0bn. [INPUT · C4] We measure the likely loss from what happened last time.
Now run that rule on three tariff levels. Today's US tariff on most Indian goods is about 10%. [INPUT] The new tariff sits on top.
Sales kept = (1 + 0.10) ÷ (1 + 0.10 + new tariff) · Sales lost = $48.0bn × (1 − sales kept) · C6
New tariff | Sales kept | Sales lost a year | Break-even Russian edge | If half of each sale is income |
|---|---|---|---|---|
+25% | 81.5% | $8.9bn | $12.8 a barrel | $6.4 a barrel |
+50% | 68.8% | $15.0bn | $21.6 a barrel | $10.8 a barrel |
+100% | 52.4% | $22.9bn | $33.0 a barrel | $16.5 a barrel |
Break-even edge = sales lost ÷ India's Russian barrels in a year, 1.9 mb/d × 365 = 694m (C7). The last column assumes only half of each lost sale was India's own income. All [MODELLED].
Today's edge is about $1. Even the smallest tariff needs more than February's best edge, $12, to break even. At 100%, the lost sales are 22.9 ÷ 1.04 = 22 times today's edge.
Supplied archive exhibit · original publication context.
What might happen: the restriction ladder. Two steps are already in place. The rest are tools the US holds.
Step | What it is | Cost to India a year | Status |
|---|---|---|---|
In force | US sanctions on Russia's two biggest oil firms. An EU ban on fuels made from Russian crude. | Already in today's prices | Since Nov 2025 and Jan 2026 [OBSERVED] |
1. Waiver with a cap | India limits Russian crude. It may join a straits mission. | $1.0–2.0bn (C9) | Possible by about 18 Oct |
2. Partial tariff | +25% to +50% on the goods taxed in 2025 | $8.9–15.0bn (C6) | Possible by about 18 Oct |
3. Full tariff | +100% on the same goods | $22.9bn (C6) | Possible by about 18 Oct |
4. Firm sanctions | Named Indian refiners, banks or ships that handle Russian oil | Not priced. Fuel exports ran near 1.4 mb/d in July | Used on Russian firms in 2025 |
5. Arms sanctions | The 2017 US law against buying Russian arms | Not priced. 40% of arms imports are Russian | Not used on India so far |
- A smaller volume does not take India off the list. The law targets the five biggest buyers. At half its volume, India would still rank second. Only a waiver removes it.
- Russia can lean on China. If India drops 0.9 mb/d, China would need about 40% more Russian crude. [MODELLED · C8] China would ask for a wider discount and collect the edge India gave up.
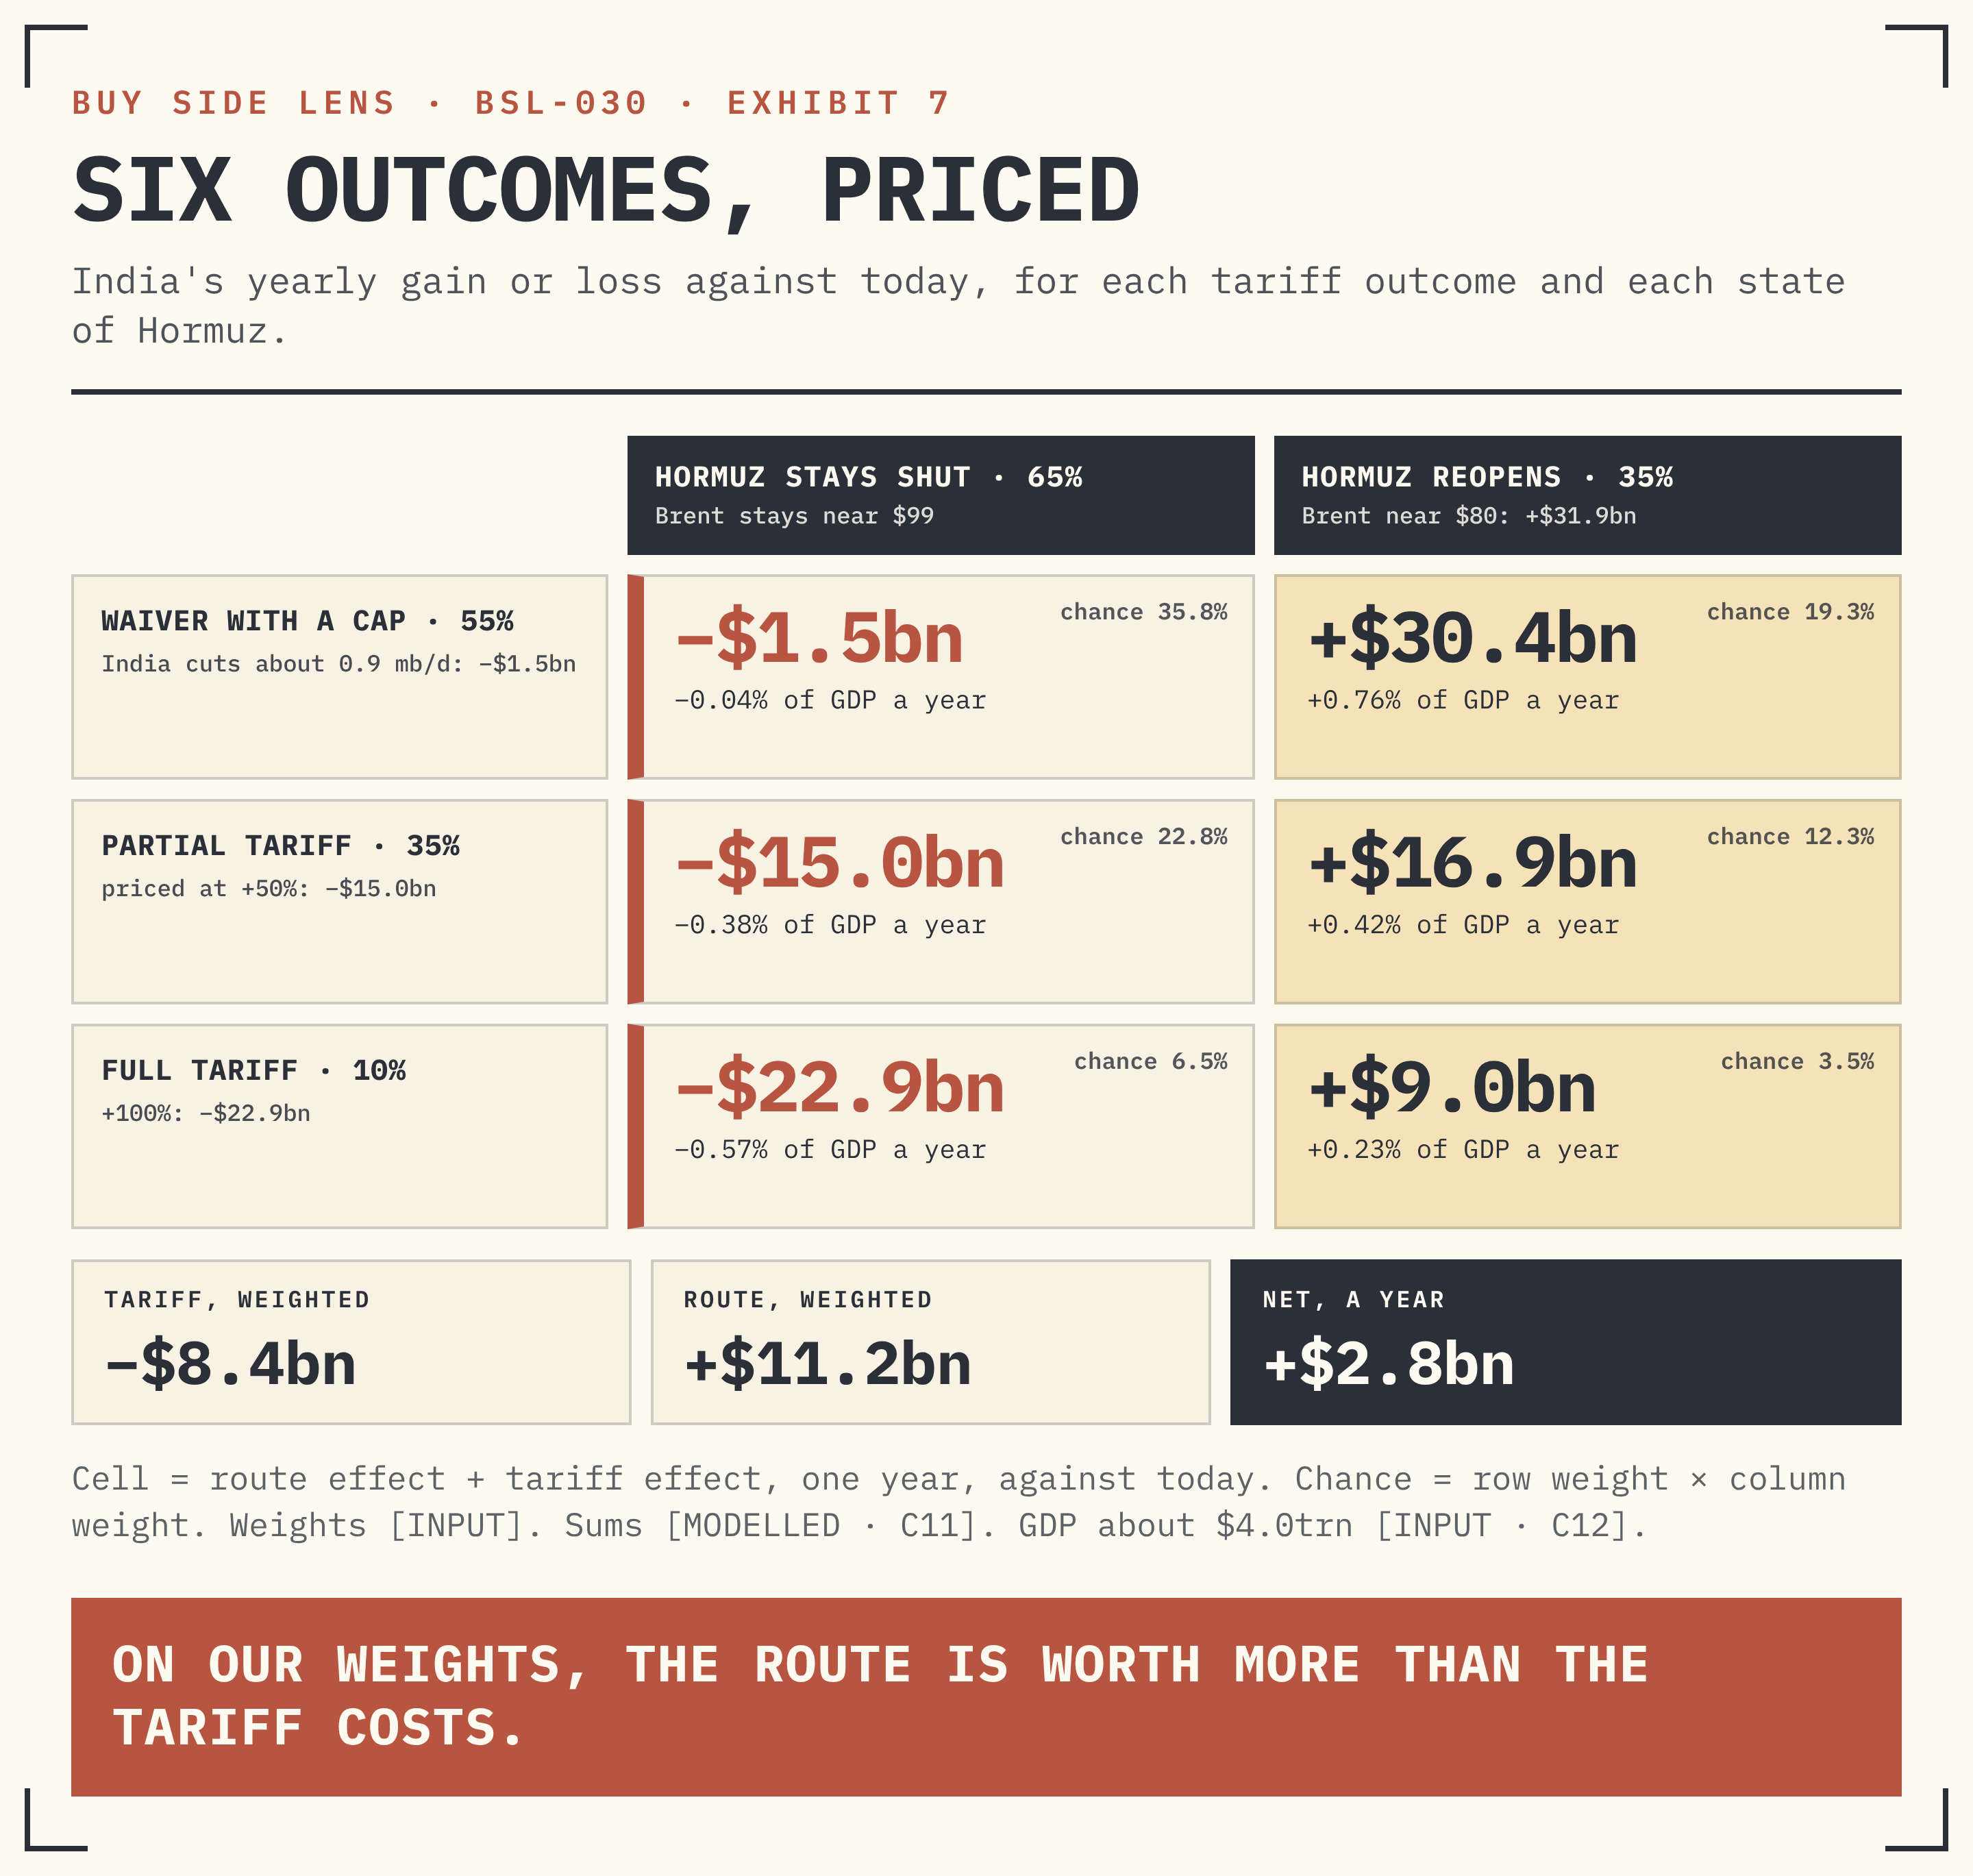
If it happens: six outcomes, priced. The tariff has three likely outcomes. The route has two. That makes six. We price each against today, for one year. All effects are cross-border flows, so they add on one ledger: India's current account.
- Tariff, by about 18 October. Waiver with a cap: 55%. Partial tariff, priced at +50%: 35%. Full 100%: 10%. India's refiners are already shopping for other crude, which makes a waiver easier to give. [INPUT]
- Route, by 23 December. Hormuz reopens and Brent falls to about $80: 35%. It stays mostly shut: 65%. Iran ties reopening to the blockade; the US ties a deal to after 3 November. [INPUT]
Supplied archive exhibit · original publication context.
IV. Price
Figure 01 · Qualitative comparison
Keep the three ledgers distinct
| Ledger | Conditional calculation | Before drawing a conclusion |
|---|---|---|
| Russian discount | Imported barrels × price edge | Match cargo dates, freight and crude quality |
| Export exposure | Affected sales × modelled demand response | Verify duties, exemptions and rerouting |
| Oil-route benefit | Import volume × assumed price change | Separate a scenario from a price forecast |
| Weighted outcome | Scenario result × chosen probability | State dependencies and judgment-based weights |
The route is worth over 40 times the discount. Nobody can say when it opens.
Where India's choice will show up in prices.
India imports about 2.08 ÷ 0.45 = 4.62 mb/d of crude. Each $1 on the oil price costs India 4.6 × 365 = $1.68bn a year; each $10 costs $16.8bn. [C2] Brent is near $99, against about $72 before the war. The $27 gap costs India 4.6 × 365 × 27 = $45.3bn a year. [C3]
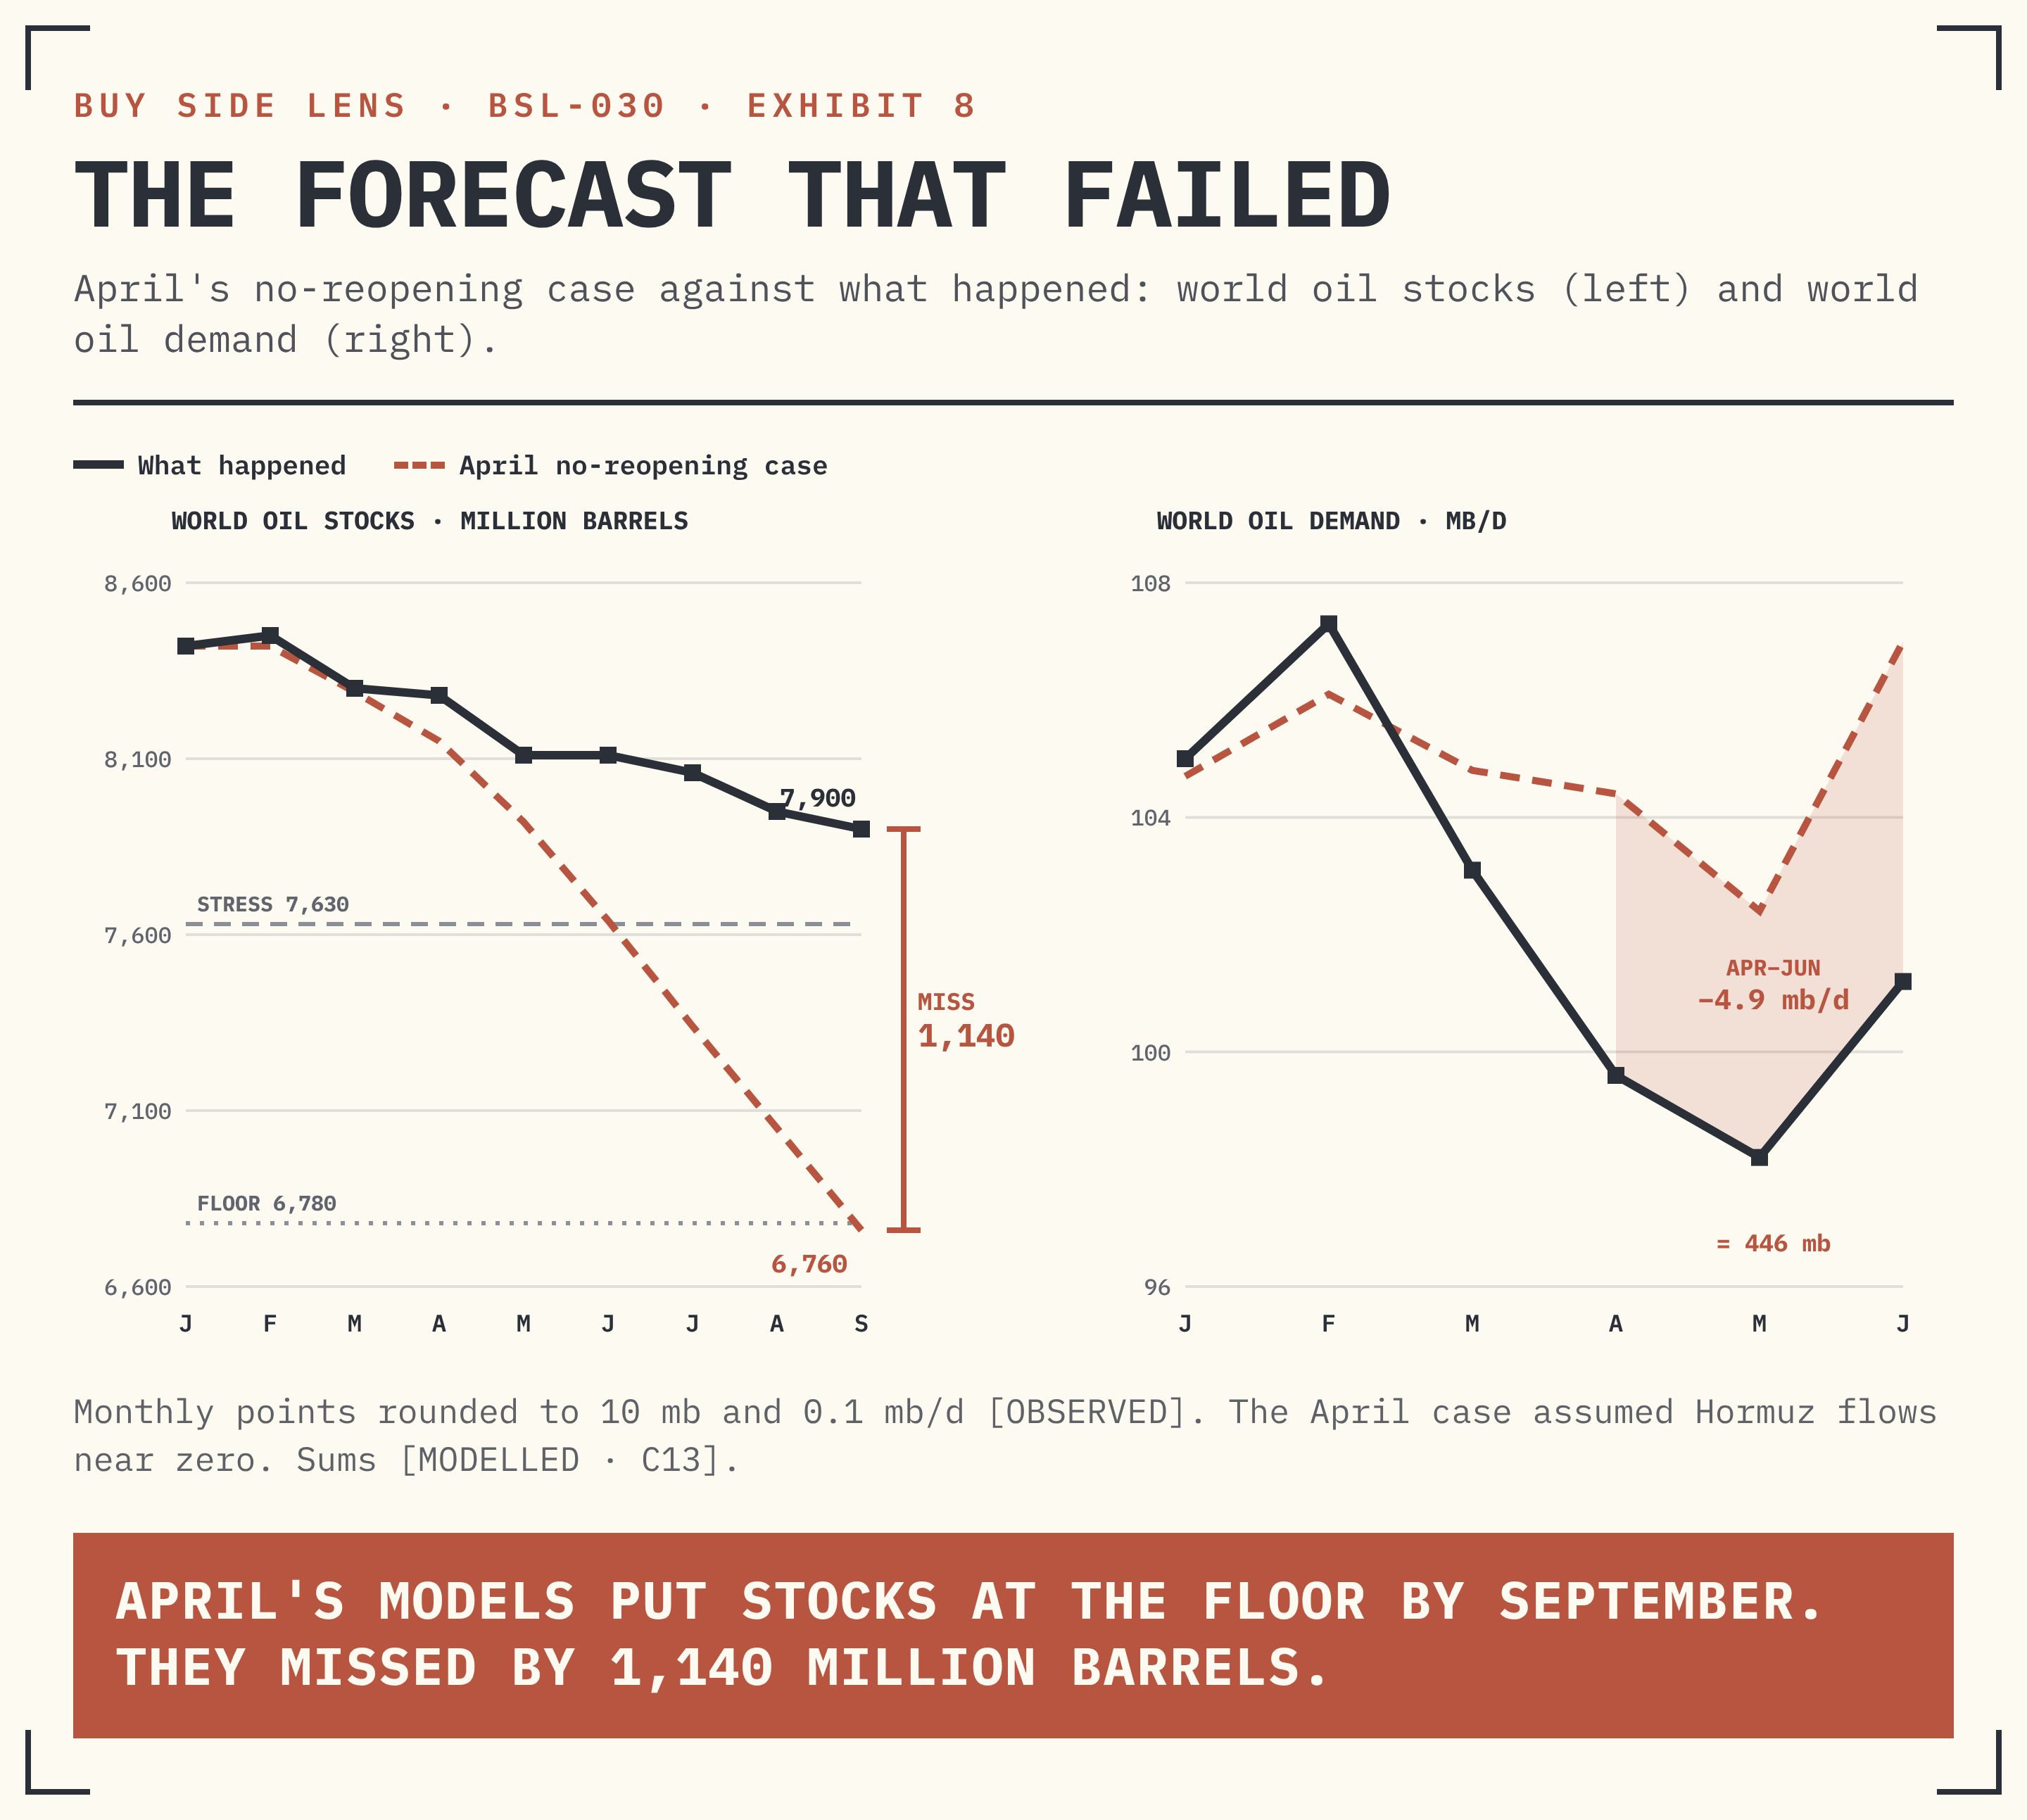
Nobody can call the oil price. In April the leading forecasts ran a no-reopening case, with Hormuz flows near zero. It put world oil stocks at 6,760 million barrels by September: the floor, below which tanks and pipes stop working. Stocks sit near 7,900. The miss is 1,140 million barrels. [OBSERVED · C13]
Two assumptions broke. Demand fell 4.9 mb/d below the April path from April to June. That is 4.9 × 91 = 446 million barrels, almost the whole miss by June. After June, the leaking strait did the rest. [MODELLED · C13]
Stocks still fall, about 2.6 mb/d since July. The stress line sits near 7,630. At that pace it arrives in about 270 ÷ 2.6 = 104 days, around the turn of the year. That is why we print weights, not a forecast. [MODELLED · C13]
Supplied archive exhibit · original publication context.
What it does to India's economy. India's economy is about $4.0 trillion a year, so $1bn is 0.025% of it. [INPUT · C12] Today the current-account deficit is 0.5% of GDP. Inflation is 4.82%, against a 4% target. The policy rate is 5.25%. The rupee trades near 95 to 96 per dollar. [OBSERVED]
Measure | Worst: full tariff, route shut | Best: waiver, route reopens | Our weighted case |
|---|---|---|---|
Yearly effect | −$22.9bn | +$30.4bn | +$2.8bn |
Share of GDP | −0.57% | +0.76% | +0.07% |
Current account | Wider by up to 0.57 pts | Narrower by 0.76 pts | Narrower by 0.07 pts |
Growth | −0.29 pts | +0.29 pts | About zero |
Inflation | No oil relief | −0.58 pts | −0.20 pts |
Rupee | More pressure | Less pressure | Little change |
Pts means percentage points. GDP: ₹345.5 lakh crore in FY26, plus 10% nominal growth, at about ₹95 a dollar. Growth: half of each lost sale is Indian income. Oil rule: a 10% move in crude moves inflation about 0.3 points and growth about 0.15 points the other way, if pump prices pass it on. All [INPUT · C12].
This Has Happened Before. Three Times.
A threat works only when a second route exists.
1515–1622 | In 1515 Portugal took Hormuz. It held the gate for 107 years. Ships across the Arabian Sea had to buy a Portuguese pass. Indian merchants paid. They had no other road. Then they built one. Pepper moved through Aceh and the Red Sea. By the 1560s that trade was back near its old size. In 1622 a Persian army and English ships took Hormuz back. The toll held only until a second route existed. |
1807–1812 | In 1807 Napoleon made Russia join his ban on trade with Britain. Britain was Russia's best customer. It bought Russian grain, timber and hemp. Russia had no second buyer. Its trade shrank. Its money lost value. On 31 December 1810 the Tsar reopened his ports to neutral ships. Napoleon invaded in June 1812. Most of his army never came home. The ban lasted three years. With no second route, it ended in war. |
2018–2019 | In 2018 India bought about half a million barrels a day from Iran. That was about a tenth of its crude. In May 2019 the US ended its waivers. India cut Iranian oil to zero within weeks. Iraq, Saudi Arabia, the UAE and the US filled the gap. Oil was plentiful. The second route was cheap. So the threat worked. |
Three eras, one shape. A threat works when the target has a cheap second route. It fails when the target has none. In 2019 India had one. In 2026 its second route runs through Hormuz and Bab el-Mandeb. The US holds the threat. France is offering to help build the route. Watch the route.
V. Position
What we would do.
We talk about groups of companies. We do not name single shares.
- Export groups taxed in 2025 (garments, gems and jewellery, seafood, auto parts, engineering goods): hold less than normal until the US names a rate or a waiver. The decision is due by about 18 October.
- Export groups spared in 2025 (phones and electronics, generic medicines): hold a normal amount.
- Refiners: keep refining profit over the oil price. Prefer coastal refiners that can run many kinds of crude. Expect fuel exports to fall first if crude runs short.
- Oil storage, pipelines and port tanks: keep holding. Longer supply routes need more room to land and store oil.
- Indian defence makers and suppliers to Western programmes: keep holding. The 40% Russian share of India's arms imports is being replaced over years. A straits mission would add work for the navy's suppliers.
- Heavy oil users (paints, tyres, airlines, logistics): stay selective. They gain most when the route reopens. Wait for ships to move, not for statements.
- Gold and dollar-linked assets: keep as insurance. They pay twice in rupees if oil and the tariff hit together.
- Bonds: short and medium over long.
Horizon: three months. Review: 23 December 2026.
The Tape
What the prices must show to change our view.
Signal | Level | What we would do |
|---|---|---|
US tariff notice | India named at 50% or more | Hold much less of the taxed export groups. |
Waiver or volume cap | Signed before about 18 October | Move the taxed export groups back to normal. |
Urals discount, landed India | Wider than $8 a barrel | India has cut. Refiners earn more on the barrels they keep. |
Hormuz flows and Brent | Tracked over 10 mb/d; Brent under $80 | Add to heavy oil users. |
World oil stocks | Below 7,630 mb, the stress line | Oil risk is back. Add to insurance. |
China's Russian buying | Waived while India's is not | Expect a deeper Indian cut and a wider Urals discount. |
India's fuel exports | Under 1 mb/d for a month | Crude is short. Cut what you expect refiners to earn. |
India joins a straits mission | Signed plan or ships assigned | The road is being built. Expect a faster Russian cut. |
Sanctions on an Indian firm | Any refiner, bank or ship named | Hold less of refiners that rely on Russian crude. |
The arithmetic / C1 – C13
The sums are simple. The definitions do the work.
Calculation | Formula and result | Limit |
|---|---|---|
C1 Edge value | 1.04 × 365 × (10 to 12) = $3.8–4.6bn; 1.9 × 365 × 1.5 = $1.04bn | Each edge is paired with its cargo month. |
C2 Oil bill | 2.08 ÷ 0.45 = 4.62 mb/d; 4.6 × 365 × $1 = $1.68bn; × 10 = $16.8bn | August volume; price effect only. |
C3 Route value | 4.6 × 365 × (99 − 72) = $45.3bn; 45.3 ÷ 1.04 = 44 | Assumes a full return to the pre-war price. |
C4 Exposure | 0.55 × $87.31bn = $48.0bn | Assumes the goods spared in 2025 are spared again. |
C5 Response | (8.1 − 6.5) ÷ 8.1 = 19.8%; 1.6 ÷ (0.55 × 8.1) = 35.9%; 1.50 ÷ 1.10 − 1 = 36.4% | Early rush and spared-goods growth pull in opposite ways. |
C6 Loss | 48.0 × (1 − 1.10 ÷ (1.10 + t)): t = 0.25 → 8.9; 0.50 → 15.0; 1.00 → 22.9; 22.9 ÷ 1.04 = 22 | One-for-one response; lost sales, before the income share. |
C7 Break-even | loss ÷ (1.9 × 365 = 693.5m bbl) = 12.8 / 21.6 / 33.0; half income: 6.4 / 10.8 / 16.5 | September volume. |
C8 China lift | 0.9 ÷ (1.25 to 1.42 + 0.95) = 38–41% | Pipeline volume taken as 0.95 mb/d. |
C9 Switch cost | 0.9 × 365 × (3 to 6) = $1.0–2.0bn | The $2–5 landed premium is an assumption. |
C10 Paid to Russia | 1.04 × 365 × (71.8 − 11) = $23.1bn; 1.9 × 365 × (99 − 1.5) = $67.6bn; 67.6 ÷ 23.1 = 2.9 | Landed prices; Russia keeps less after freight. |
C11 Six outcomes | 4.6 × 365 × (99 − 80) = $31.9bn; 0.55 × (−1.5) + 0.35 × (−15.0) + 0.10 × (−22.9) = −$8.4bn; 0.35 × 31.9 = +$11.2bn; net +$2.8bn; (0.35 + 0.10) × 0.65 = 29% | Weights are our judgement; the waiver cost is the C9 mid-point. |
C12 Economy | 345.5 × 1.10 ÷ 95 = $4.0trn; 22.9 ÷ 4,000 = 0.57%; 30.4 ÷ 4,000 = 0.76%; 0.5 × 22.9 ÷ 4,000 = 0.29 pts; (99 − 80) ÷ 99 = 19.2%; 1.92 × 0.3 = 0.58 pts; 1.92 × 0.15 = 0.29 pts | Rules of thumb; full pass-through to pump prices. |
C13 Stocks and flows | 7,900 − 6,760 = 1,140 mb; (104.6 − 99.7) × 91 = 446 mb; (8,060 − 7,900) ÷ 62 = 2.6 mb/d; (7,900 − 7,630) ÷ 2.6 = 104 days; 7 + 1.5 = 8.5 mb/d; 8.5 ÷ 21 = 40%; 7.5 ÷ 12 = 62% dark | Rounded to 10 mb and 0.5 mb/d; monthly stocks, weekly flows. |