Original Lens and publication context
Two months on, the Hormuz shock has stopped being an oil story. It is a refined-product squeeze and a fertilizer planting catastrophe — and both transmission lines now point at India.
- Two months in, Brent has averaged near $100 — that is the signal, not the mystery. Refiners across Asia and Europe cut runs by 2.1 mbd in March and 3.8 mbd in April; the Middle East has lost an estimated 4.7 mbd of refined product exports.
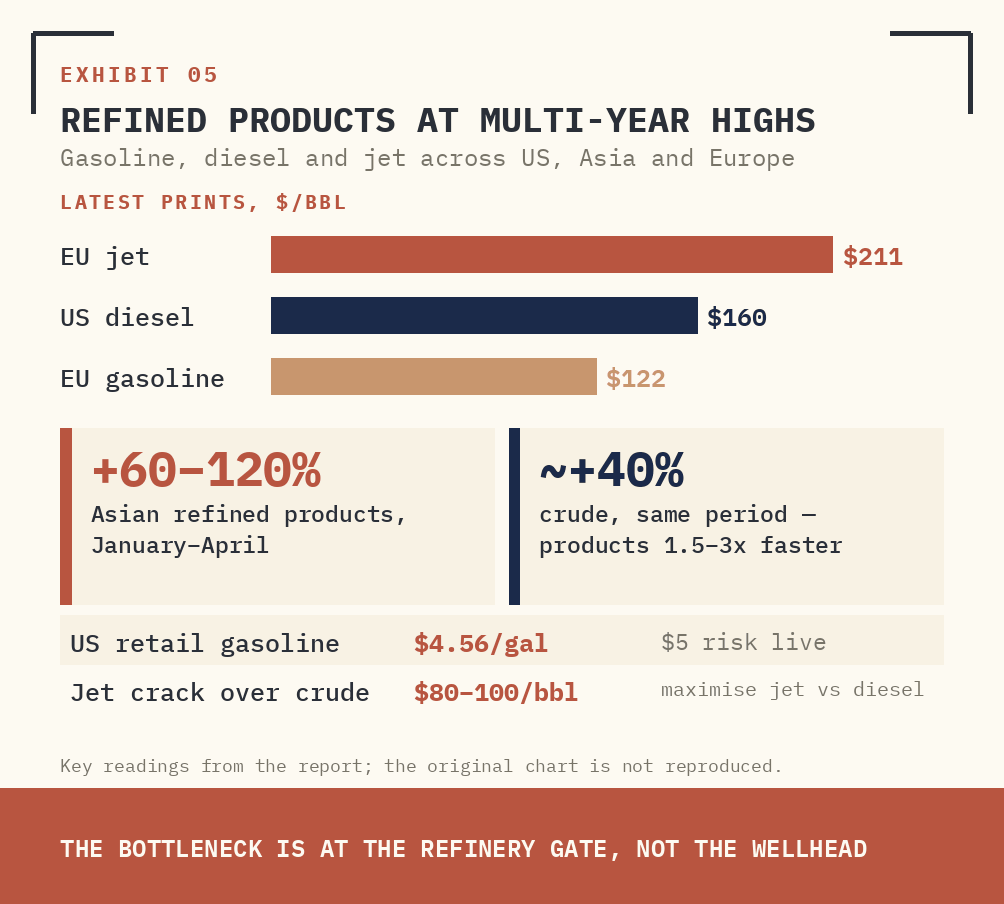
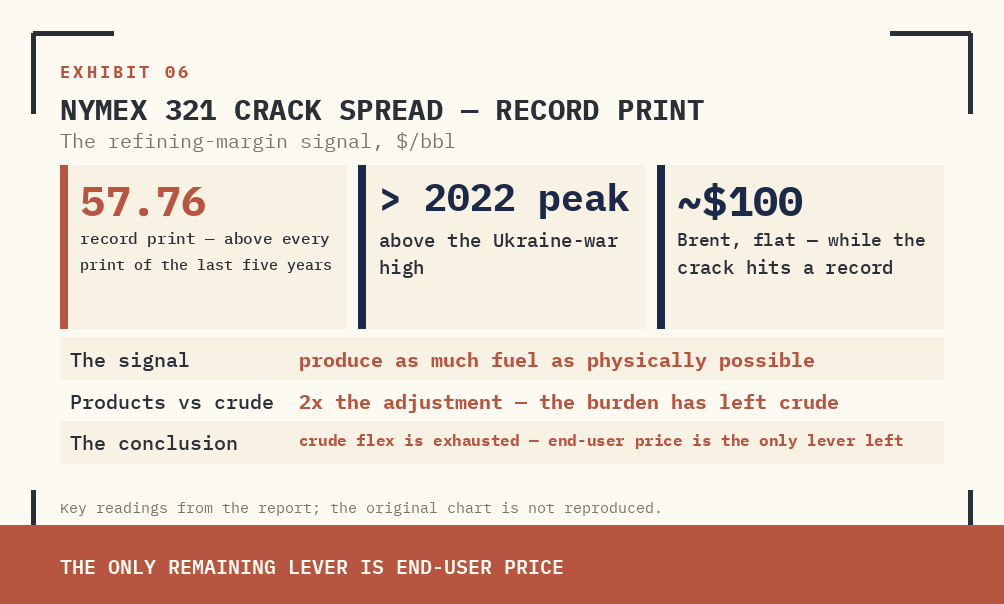
- The shock is clearing inside the barrel: crude is up roughly 40% since January while Asian refined products are up 60–120%. Jet cracks run $80–100/bbl over crude, the US 321 crack spread printed a record 57.76, EU jet is $211/bbl and US diesel $160/bbl.
- Pipe two is fertilizer and food: a third of globally traded nitrogen normally transits Hormuz and is not moving. 70% of US farmers cannot afford the fertilizer they need, US wheat acreage is at a 1919 low, global grain output is modelled 53 mt lower.
- Both pipes converge on India: Qatari LNG through Hormuz feeds the urea plants — a ₹30,000–50,000 crore subsidy expansion on a ₹1.6–1.8 lakh crore base — while seasonal diesel demand meets a disrupted global refined-product market. Kharif planting demand peaks June–July.
- Position: sector-level signals, not securities calls — complex-refinery margins and distillate export licensing, marketing-margin compression in the retail channel, urea production cadence and the subsidy bill, ATF for airlines, rural FMCG volumes, INR and the G-sec curve as food CPI lands, gold in rupee terms.
I. THE TRIGGER — THE SHOCK CHANGES SHAPE
Two months and one week into the largest oil supply disruption on record, Brent has averaged near $100. That single line of price action is the entire mystery of this crisis. Crude is not where the shock is showing up — and that is precisely the signal.
The adjustment has moved past crude. Refiners across Asia and Europe cut runs by 2.1 mbd in March and 3.8 mbd in April. The Middle East has lost an estimated 4.7 mbd of refined product exports outright. The system has stopped trying to clear at the wellhead and is instead clearing inside the barrel — pushing the stress downstream into the fuels that consumers, fleets, airlines, farmers and food chains actually buy.
EXHIBIT 01 CHINA INDEPENDENT REFINERS — IMPORTED CRUDE MARGINS
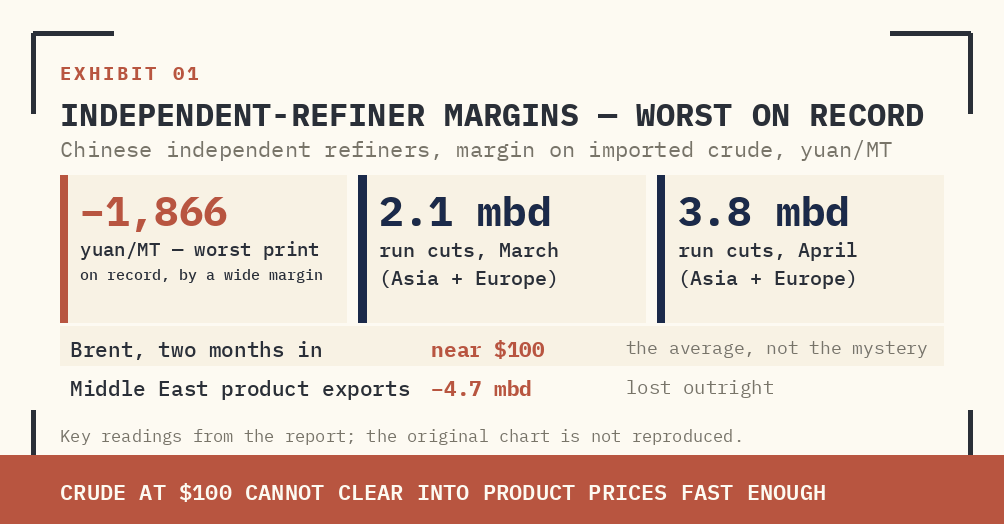
Supplied archive exhibit · original labels. Read alongside the editorial corrections.
Consumers don't buy crude. They buy fuels. The next phase of this shock looks less like a crude spike and more like a refining and end-user crunch.
And outside the refinery gate, a second transmission line is running in parallel — quieter, slower, and ultimately more dangerous. Roughly one-third of all globally-traded nitrogen fertilizer normally moves through Hormuz. It is not moving now. The spring application window across the northern hemisphere closes next month. Inputs that arrive after the relevant application window can reduce yields or change planting decisions; the size of the harvest effect depends on crop, soil, timing and substitution.
II. FLOW — THE TWO PIPES THAT BROKE
The shock is now flowing through two distinct channels, both originating at Hormuz, both invisible in the headline Brent print.
Pipe one is refining. Refining is fundamentally mass-balance — every barrel splits by chemistry and hardware, and refiners have only narrow flexibility (2–5%) to shift output between fuels. From January through April, crude rose roughly 40% while refined product prices in Asia rose 60–120%. Products are repricing 1.5x to 3x faster than crude. To date they have shouldered twice the adjustment.
EXHIBIT 02 WHY REFINING IS A ZERO-SUM GAME — YIELDS BY CRUDE GRADE
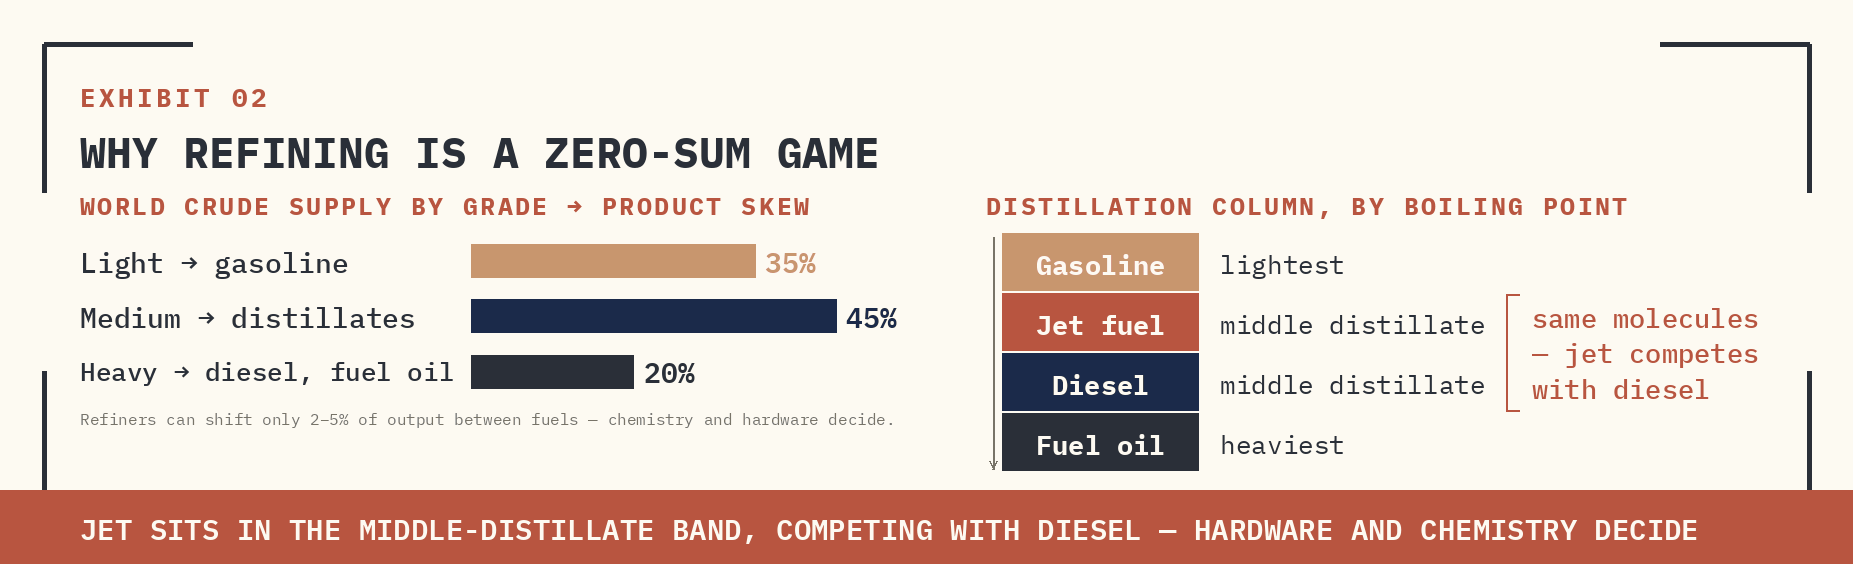
Supplied archive exhibit · original labels. Read alongside the editorial corrections.
Pipe two is fertilizer and food. Spring application in the northern hemisphere runs through June. Parts of Africa are entering primary planting now. An industry survey shows 70% of US farmers cannot afford the fertilizer they need this season. US wheat acreage will be the lowest since record-keeping began in 1919. The International Grains Council models cumulative global wheat and coarse-grain output 53 million tons below last season — larger than Ukraine's entire annual grain export.
A missed input window can reduce a harvest; it does not automatically eliminate it. The shortfall will not announce itself until next fall.
III. RISK — WHERE THE STRESS IS COMPOUNDING
Three risk layers are now compounding simultaneously, none of which a stable Brent print will reveal.
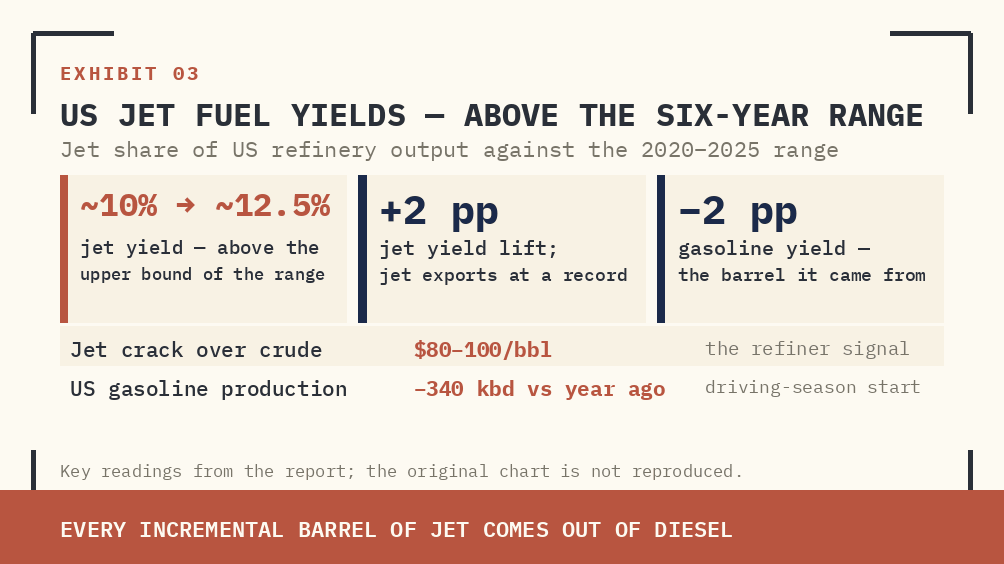
Refinery yield tug-of-war. Jet fuel and diesel compete for the same middle-distillate molecules. Jet cracks have widened to $80–100/bbl over crude — an extraordinary signal. US refiners have lifted jet yields by 2 percentage points and jet fuel exports have hit a record. Every barrel of incremental jet comes out of diesel. Gasoline yields have already fallen 2 percentage points; US production is 340 kbd below year-ago levels at the start of the driving season.
EXHIBIT 03 US JET FUEL YIELDS — BREAKING ABOVE THE SIX-YEAR RANGE
Supplied archive exhibit · original labels. Read alongside the editorial corrections.
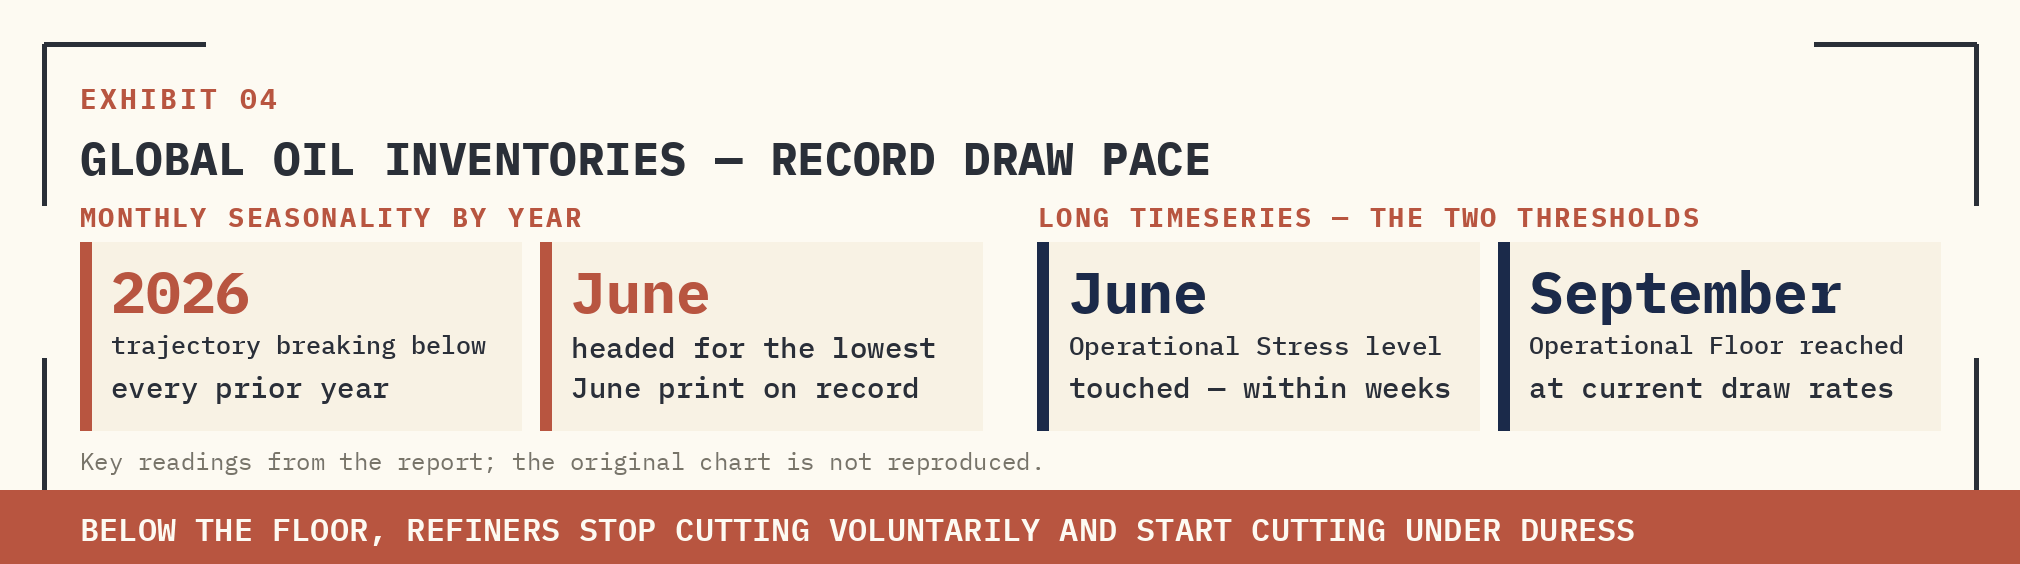
Inventory floor approaching. The collapse in global oil inventories is on record pace. At current draw rates, OECD inventories pass the operational stress threshold within weeks and reach the operational floor by September. Below the floor, system-wide refining adjustments stop being voluntary and become forced.
EXHIBIT 04 GLOBAL OIL INVENTORIES — RECORD DRAW PACE
Supplied archive exhibit · original labels. Read alongside the editorial corrections.
Food-supply latency. The fertilizer shortfall is invisible until autumn. Application missed in May cannot be made up in July. Even a same-day Hormuz reopening still requires weeks of vessel transit and months of supply-chain normalization — the US House Agriculture Committee's own framing in correspondence to USDA. Late input delivery can leave yield losses that a subsequent reopening does not fully reverse. The price of the missed planting will appear at the supermarket shelf, not at the gas pump, and it will appear in the second half of this year.
Crude can stabilise near $100 even as product cracks widen sharply. Stable Brent is no longer evidence the crisis is contained.
Figure 01 · Qualitative comparison
Two transmission clocks
| Channel | First pressure point | Later consequence |
|---|---|---|
| Refined fuels | Feedstock and refinery constraints | Transport costs and sector margins |
| Fertilizer | Gas feedstock and input delivery | Planting decisions and potential yield effects |
| Public policy | Subsidies and retail price decisions | Fiscal cost and consumer inflation |
IV. PRICE — WHERE THE SHOCK IS CASHED OUT
Pricing has decoupled from crude. The chase is happening one rung down — in cracks, in fertilizer benchmarks, in food futures. The charts and table below capture the current shape of the move.
EXHIBIT 05 REFINED PRODUCTS — THE VERTICAL AT THE RIGHT EDGE
Supplied archive exhibit · original labels. Read alongside the editorial corrections.
EXHIBIT 06
NYMEX 321 CRACK SPREAD — RECORD PRINT
Supplied archive exhibit · original labels. Read alongside the editorial corrections.
ASSET | MOVE YTD | DRIVER |
|---|---|---|
Brent crude | +40% | Capped near $100 by demand destruction and downstream absorption |
Asia refined products basket | +60% to +120% | Crude bottleneck pushing all stress into product cracks |
Jet fuel crack over crude | $80–100 / bbl | Refiner signal to maximize jet at the expense of diesel |
US retail gasoline | $4.56 / gal | $5 risk live; driving season opens Memorial Day |
US 321 crack spread | Ukraine-war record highs | Refining margin signal — primary transmission channel |
Urea (granular FOB) | Multi-year highs | Hormuz LNG feedstock loss; one-third of nitrogen trade halted |
IGC wheat & coarse grain | −53 mt vs last season | Application window closing; planting acreage at 1919 lows in US |
Brent vs Asia product margin | Products 2x adjustment | Adjustment burden has moved out of crude entirely |
V. POSITION — INDIA TRANSMISSION SIGNALS TO MONITOR
The macro shock now propagates through two timing channels with very different feedback loops. Refined-product transmission is observable now; food and fertilizer transmission shows up later, in Q3 and Q4. The table below organises the data flows worth tracking across the period — sector-level signals and the mechanisms behind them, not securities-specific calls.
THEME | SIGNAL TO MONITOR | MECHANISM |
|---|---|---|
Indian refining sector | Complex-refinery margin trends; export licensing of distillate barrels | Refinery configuration determines capture of the middle-distillate premium when cracks widen |
Oil marketing channel | Marketing-margin compression; retail price pass-through cadence | Cracks expand the wholesale-retail gap absorbed under retail price discipline |
Indian fertilizer sector | Urea production cadence at LNG-dependent plants; subsidy bill trajectory | Hormuz-routed Qatari LNG is the binding feedstock constraint; political imperative ahead of kharif protects volume |
Agri-input chain | Planting damage data August–September; policy support announcements | Food CPI inflection drives policy response; window opens once damage data prints |
FMCG staples channel | Rural volume trajectory; gross-margin compression visibility | Food-inflation pass-through compresses volumes before pricing power returns |
Indian aviation channel | ATF (aviation turbine fuel) trajectory; airline hedging programme disclosures | Jet fuel runs into double-digit-percent of cost base; cracks at $80–100 amplify unhedged exposure |
INR pressure points | Energy and fertilizer import bill compounding; RBI intervention pattern | Twin-deficit pressure as both pipes converge on the current account |
G-sec curve dynamics | Food CPI tail through H2; RBI rate-path expectations | Food CPI prints land after the planting window closes; constrains the rate-cut window |
Gold (rupee terms) | Hormuz duration; INR translation amplification | Twin tailwind: geopolitical risk premium plus currency translation |
The signal is no longer the oil price. It is the path the shock takes after the oil price has stopped moving.
Trigger. Flow. Risk. Price. Position. — Refining transmission through Q2; food and fertilizer transmission through Q3–Q4. The second leg is approaching while the first is still unfolding.