Original Lens and publication context
A very close friend — an experienced market professional — asked us two questions this week: why is the Indian market falling, and are the Delhi student protests to blame? Here is our full answer, explained so simply that anyone can follow it.
- India’s "fear meter" — the India VIX — is lower today than on 6 June, the day the student protests began. The market is simply not afraid of the protests.
- The rupee’s small 0.3% fall this week is because of oil prices, not protests. And foreign investors are still lending money to the Indian government — keeping the 10-year bond yield below 7%.
- Indian stocks are among Asia’s worst performers in 2026 — but for older reasons: costlier oil after the US-Iran war, and almost $27 billion of foreign selling in stocks.
- Markets will start worrying only if one of four things happens: the government looks weakened, important laws get stuck, there is a harsh crackdown, or the protests spread across the country.
- The real long-term worry is not the protest itself but what caused it — youth unemployment near 15% and an average income of only about $3,000 per person.
The Phone Call That Started This Report
Yesterday evening, one of our closest friends called. He is not a beginner — he is a very experienced market professional. His first question was the one everyone is asking these days: "Why is the Indian market going down?" We went through the usual reasons. Oil has become expensive. Foreign investors have been selling. Fair enough.
Then came his second question, and it was the better one: "Do you think the student protests going on in Delhi are also hurting the market?"
Our answer was simple: not yet. And the word "yet" is the most important word in that sentence. This report is that phone conversation, written down step by step — so that anyone, even someone completely new to markets, can learn how professionals decide whether a big political event actually matters to money. Read slowly. Every difficult word is explained.
Step 1: What Is Actually Happening in Delhi?
Students in Delhi have been protesting since early June. The anger started with an examination paper leak. The protesters say their demands have not changed, and the protests will continue until those demands are met. The Prime Minister has responded publicly — calling the paper leak a serious matter, saying the culprits have been caught, and promising fast-track courts and strict punishment.
One more thing makes this moment notable: this is the first protest of this size against the current government, and it comes after a wave of youth protests in neighbouring countries that ended up changing their politics. So the event is real. The anger is real. The question is: does the market care?
Step 2: The Three Simple Checks
Here is the professional habit we want to teach you. When something dramatic happens in a country, do not ask "is this big news?" News is emotion. Ask a colder question: "is money changing its behaviour?" Money shows its true feelings through three things, and you can check all three for free.
Check one: the fear meter. India has an index called the India VIX. Think of it as a fear meter for the stock market. It reflects expected volatility derived from option prices. It is often used as a gauge of market anxiety, but it is not a direct probability of a crash. When people are scared, insurance becomes expensive and the fear meter jumps up. Now look at the chart below.
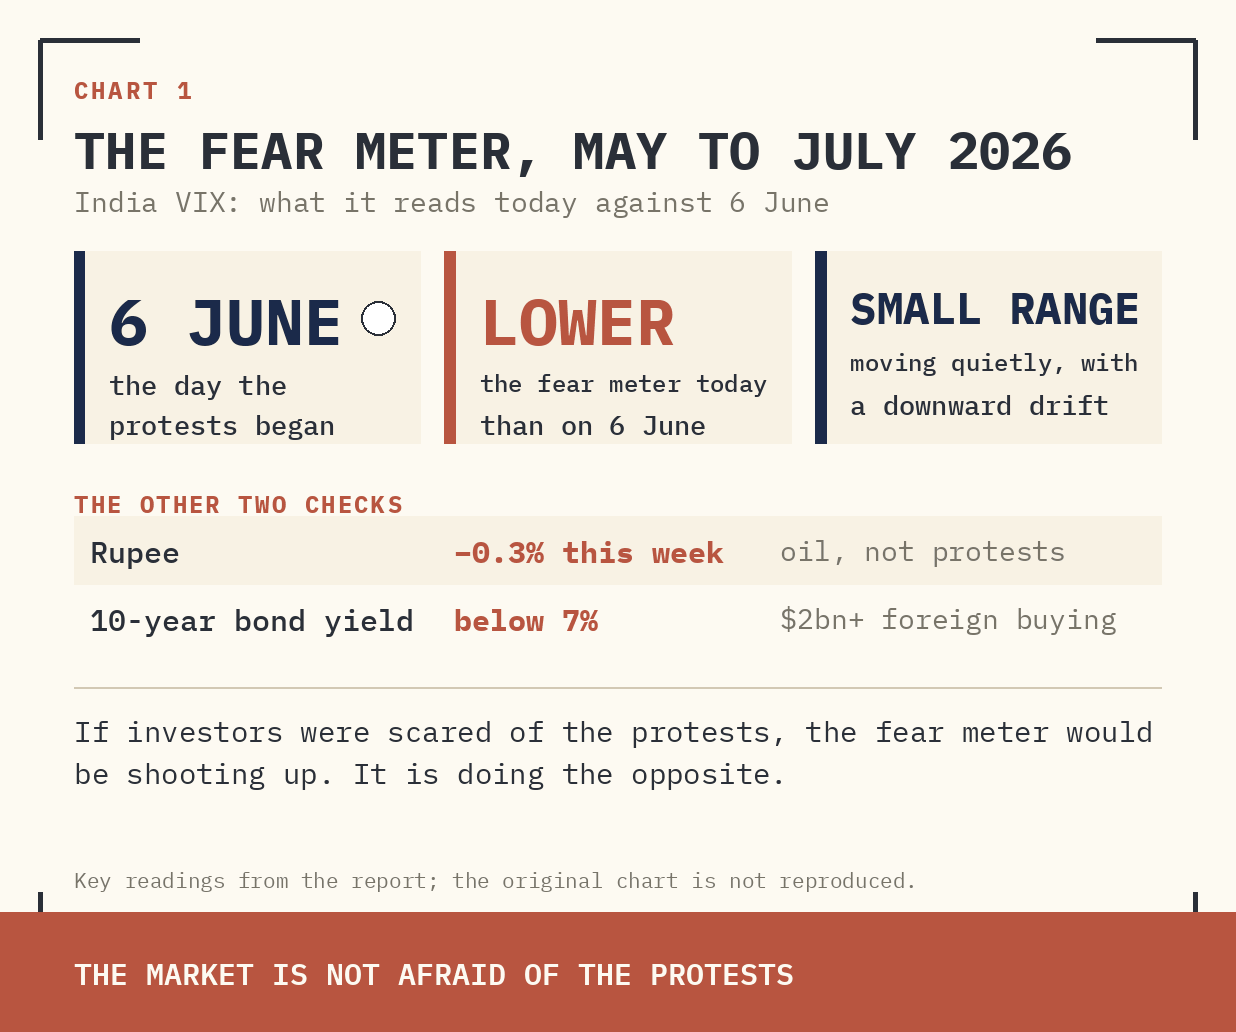
Supplied archive exhibit · original labels. Read alongside the editorial corrections.
What this chart tells you: The orange line is the fear meter. Notice the white marker in the middle — that is 6 June, the day the protests started. The line today is LOWER than it was on that day, and it is moving quietly in a small range (the white arrow shows the downward drift). In simple words: the stock market is more relaxed today than it was before the protests even began. If investors were scared of the protests, this line would be shooting up. It is doing the opposite.
Check two: the currency. When money truly fears a country’s politics, the first thing it does is leave — and to leave, it must sell the rupee. The rupee did fall about 0.3% this week towards a record low. But there were no sharp, panicky moves. And the reason for the fall is oil, not protests. India buys most of its oil from other countries. When oil becomes costly, India needs to sell more rupees to buy dollars to pay for it. So the rupee’s weakness is an oil story.
Check three: government borrowing. The government borrows money by selling bonds. The "10-year bond yield" is simply the interest rate — the rent — the government pays to borrow money for ten years. If investors feared trouble in India, they would demand higher rent. Instead, the rent has stayed below 7%. Why? Because foreign investors are actually lending MORE money to the Indian government — they have bought more than $2 billion of Indian government bonds. Ask yourself: would you lend your money to a country for ten full years if you feared it was becoming unstable? No. Neither would they.
Three checks: the fear meter, the currency, the borrowing rate. When political trouble is real, all three shout together. Right now, none of them is even whispering.
Step 3: So Why Is the Market Actually Falling?
Because of problems that started long before any student sat down on a Delhi street. Indian stocks were already among the worst performers in Asia this year. Two forces explain it.
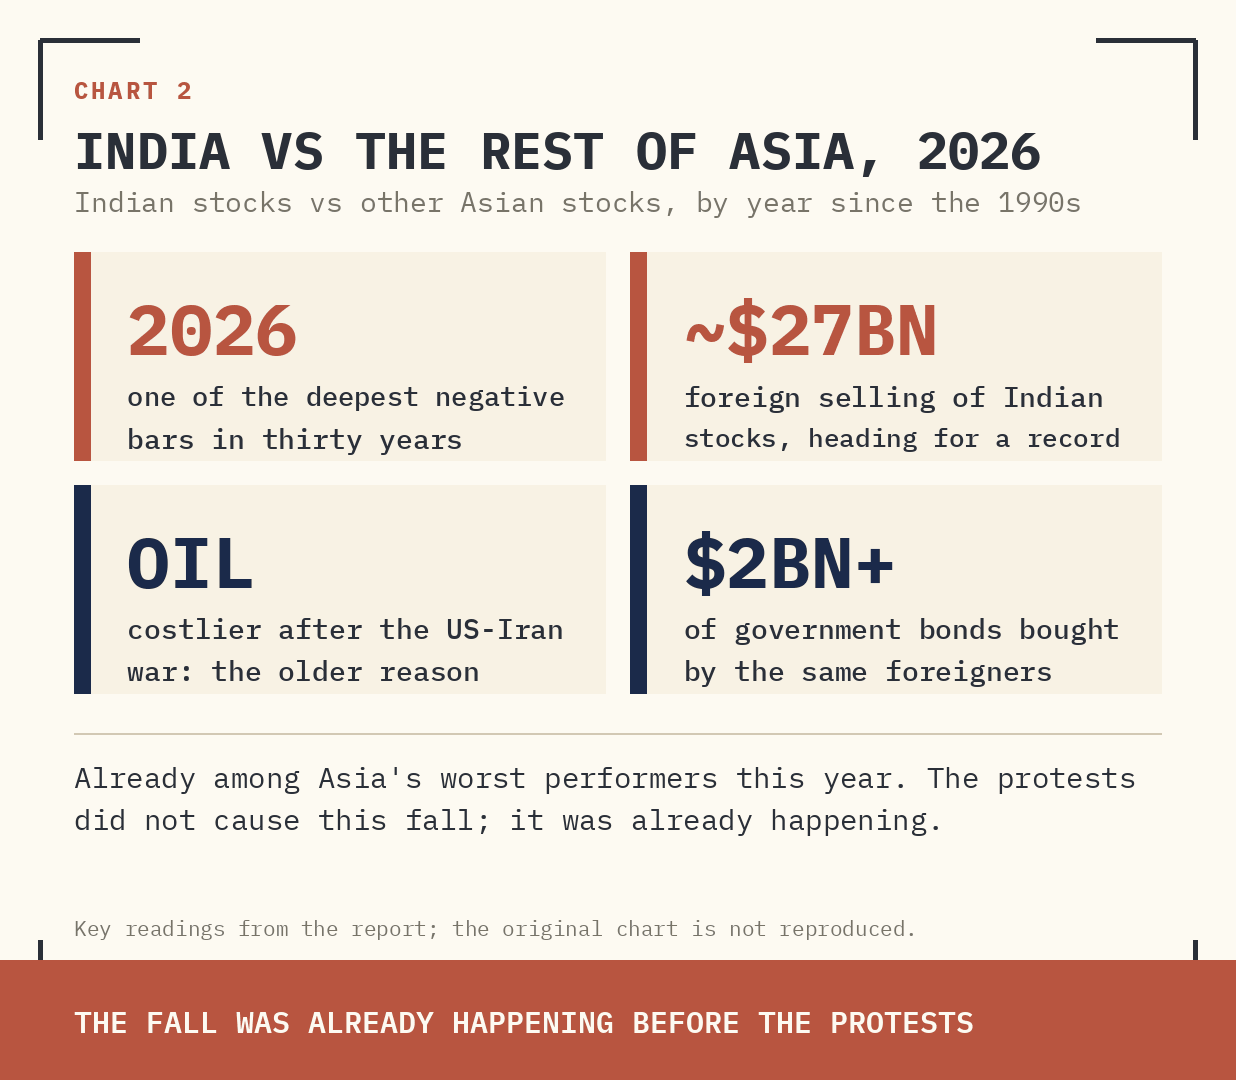
Supplied archive exhibit · original labels. Read alongside the editorial corrections.
What this chart tells you: Each bar shows one year. When the bar is above the zero line, Indian stocks beat the rest of Asia that year. When it is below, India did worse. Look at the last bar on the right — 2026, shown in white. It is one of the deepest negative bars in thirty years. This underperformance began with oil and foreign selling months ago — long before the protests. The protests did not cause this fall; the fall was already happening.
Reason one — expensive oil. After the US-Iran war, crude oil prices jumped. India imports most of its energy, so costly oil pushes up prices of everything, squeezes company profits, hurts household budgets, and weakens the rupee — all at the same time.
Reason two — foreign selling. Foreign funds have pulled almost $27 billion out of Indian stocks in 2026 — heading for their biggest yearly selling ever, although the selling has slowed in recent weeks. But notice something clever: the SAME foreign investors who are selling Indian stocks are BUYING Indian government bonds. That tells you they are not afraid of India as a country. They simply think Indian stocks became too expensive compared to the profits companies are making.
Even India’s central bank agrees. The Reserve Bank of India’s latest assessment is that the economy remains strong, and it names the immediate risks: fresh uncertainty in the Middle East, and a weak monsoon that has delayed crop planting. Read that list again — the central bank did not put the protests on it.
Figure 01 · Qualitative comparison
Three checks, three different questions
| Indicator | Question | What it cannot prove |
|---|---|---|
| India VIX | Has expected equity volatility changed? | The cause of volatility or a crash probability |
| Rupee | Has the balance of dollar demand and supply changed? | A unique political cause |
| Government bond yield | Has the price of rupee borrowing changed? | That all investors agree about politics |
Step 4: What Would Make the Market Worry?
In portfolio-management circles, the thinking is blunt: markets are not nationalist, and they are not loyal to any government or any ideology. They are loyal to one thing only — profits. By that cold standard, these protests are not yet creating either strong greed or strong fear among the people who move large money. Economists who track Asia add a note of caution, though: the protests are still too small and too local to move markets, but they are beginning to catch attention — especially after youth protests in neighbouring countries recently ended up reshaping their politics.
So what would turn this protest from background noise into a real market event? We are watching four warning signals:
Signal one: the government starts looking politically weak. Long-term investors are really buying one thing — stable policies. A weak government cannot promise that.
Signal two: important laws get stuck in Parliament. This is the first measurable sign that a government has lost its grip.
Signal three: a harsh crackdown on the protesters. That changes how the whole world sees the country’s risk.
Signal four: the protests spread across the country. Size is what turns a local complaint into a national problem for markets.
None of these four signals has fired. And here is the useful part: the day one of them fires, our three simple checks — the fear meter, the rupee, the borrowing rate — will tell you before any news channel does.
Step 5: The Bigger Story Hiding Behind the Protests
Now comes the part that separates a professional from everyone else. A professional always separates the SPARK from the FUEL. The spark was one leaked exam paper. The fuel has been building for twenty years.
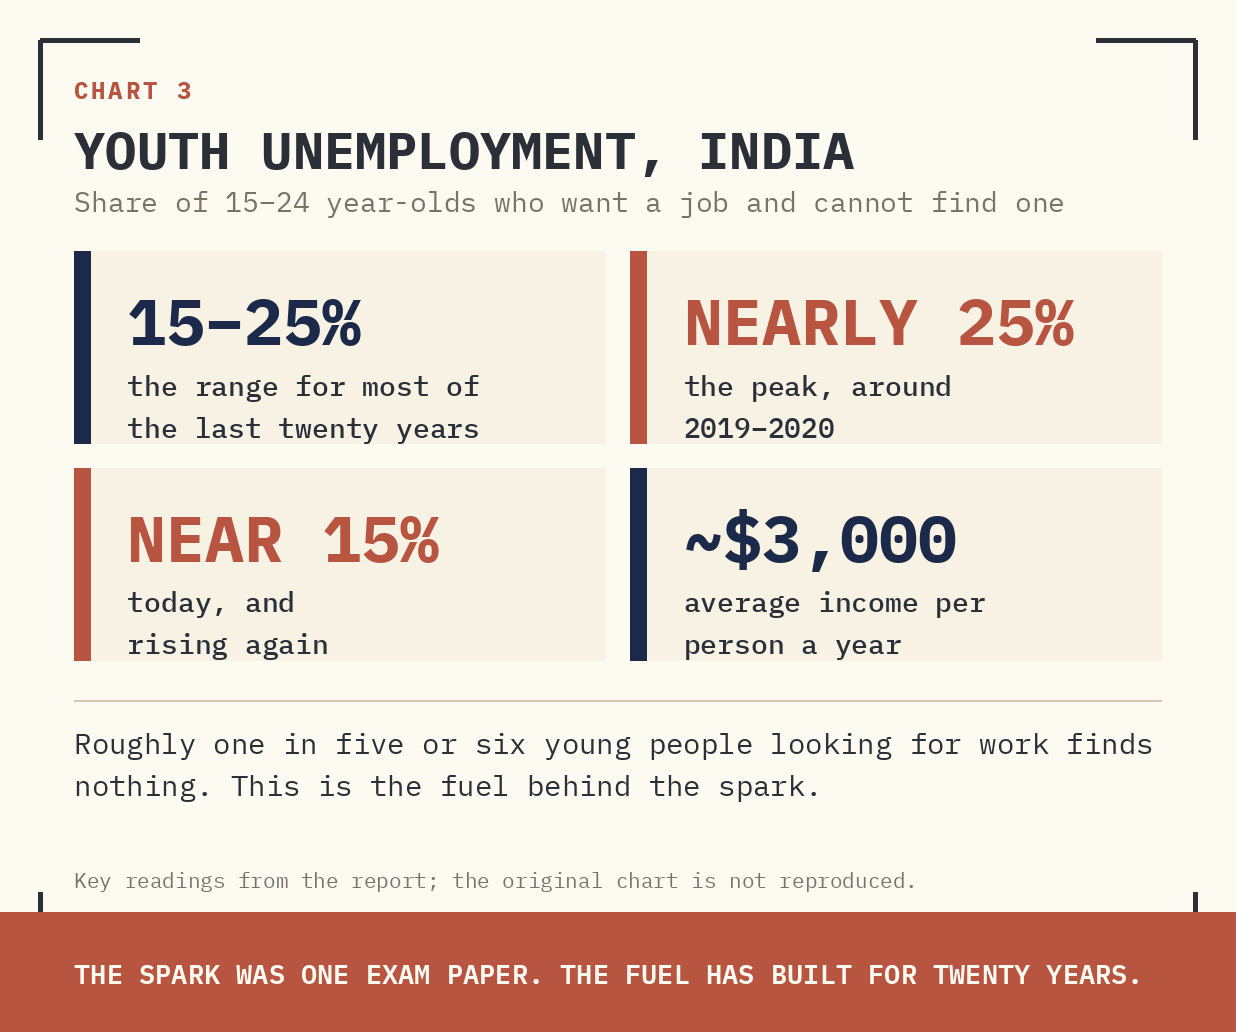
Supplied archive exhibit · original labels. Read alongside the editorial corrections.
What this chart tells you: This line shows what share of young Indians who want a job cannot find one. For most of the last twenty years it has stayed between 15% and 25% — meaning roughly one in every five or six young people looking for work finds nothing. It touched nearly 25% around 2019–2020, came down, and is now near 15% and rising again. This is the fuel. When one in six young people cannot find work, a single leaked exam paper is enough to fill the streets.
There is a second number behind the anger. India is one of the fastest-growing large economies in the world — yet the average income per person is still only about $3,000 a year, one of the lowest among comparable countries. Fast growth, but not enough jobs and not enough income. And in the age of artificial intelligence, the bar is rising: the country must produce the practical skills that employers actually need.
That is why the protests were never really about one exam. They are about whether the world’s fastest-growing large economy can create jobs for the world’s largest young population. The protests may end next week. This chart will still be there. This is the slow-burning risk we track — because if it stays unsolved, it will eventually show up in spending, then in politics, and finally in stock prices.
Four Rules to Remember
If you remember nothing else from this report, remember these four rules:
Rule one: never ask "is this news big?" Ask "does this change where money flows?"
Rule two: before forming any opinion, look at the three checks — the fear meter, the currency, the borrowing rate. They are the market’s heartbeat, and they do not lie for long.
Rule three: always separate the spark from the fuel. Sparks make headlines; fuel makes trends.
Rule four: decide in advance what would change your mind — our four warning signals — so that you react to evidence, not emotion.
Markets do not price anger. They price power, policy, and profits. Nothing else.
Why We Do This
If you read our earlier special report, “Raising Supermen,” you already know what Buy Side Lens is building: intelligence that makes markets, economics, and world politics genuinely easy to understand — for young curious minds and for adults who want to master how the world really works.
We are not tipsters. We are not traders chasing the next price move. We are not cheerleaders for any party or any ideology. Buy Side Lens is a collective — people trained on the trading floors of Goldman Sachs and HSBC, portfolio managers from top hedge funds, Ivy League graduates, geopolitical analysts, and former military officers — pooling their knowledge into one lens. On those desks, opinions are cheap and only money flows matter. We hold one simple belief: capital is the world’s most honest voting machine. Money flows to wherever it is treated best, and those flows — not speeches, not slogans — finally decide outcomes. Our only job is to watch where the money is moving, understand why, and explain it to you in plain language.
Yesterday it was a football World Cup model. Today it is a protest in Delhi. Tomorrow it will be something else. The method never changes: understand the machine, ignore the noise.
This is Buy Side Lens Intelligence. Follow the money.