Original Lens and publication context
A Consumer-Skewed Compounder Hidden Inside an Energy Chassis
- India's largest listed conglomerate closed FY26 with record revenue of ₹11,75,919 crore (+9.8%), EBITDA of ₹2,07,911 crore (+13.4%) and PAT of ₹95,610 crore (+18.3%). Q4 PAT fell 12.6% to ₹16,971 crore on O2C margin compression — the printed bottom of the energy cycle, not a thesis-breaker.
- The consumer franchises are now the engine room: digital and retail delivered about ₹1,08,000 crore of FY26 EBITDA, over half the consolidated total. The digital arm grew Q4 EBITDA 17.9% with margins up 230 basis points to 52.4%, on 524.4 million subscribers.
- The market still applies an energy-style multiple to the whole group. Our sum-of-the-parts on FY28E earnings puts the digital arm at 13x EV/EBITDA and the retail arm at 25x — together 70% of gross value — with a 5% holding-company discount.
- Three catalysts compress the timeline: the digital arm's listing, which management confirms is advancing; retail margin recovery from H2 FY27 as hyper-local commerce economics stabilise; and first New Energy revenue. O2C needs only mid-cycle margins: ₹75,000 crore FY28E EBITDA from a ₹62,000 crore trough.
- Risks: a further West Asia leg hitting O2C (Q4 already absorbed ₹2,000–3,000 crore of margin compression), an ARPU shortfall (each ₹10 is roughly ₹6,000 crore of annual revenue before incremental costs), Q-commerce intensity, New Energy execution and a wider holding-company discount if the listing slips beyond FY27.
India's largest listed conglomerate closes FY26 with record revenue of ₹11.76 lakh crore and PAT of ₹95,610 crore, even as Q4 print confirmed the energy cycle bottom we had flagged. Consumer franchises now contribute over half of consolidated EBITDA. Three catalysts compress the realisation timeline: the digital arm's listing, Retail re-acceleration through hyper-local commerce, and New Energy first revenue.
KEY DATA SNAPSHOT
The table below summarises valuation and key statistics. Detailed methodology is presented in the SOTP Valuation section. All values reflect data as of 25 April 2026 unless otherwise stated.
KEY DATA SNAPSHOT · INDIA'S LARGEST LISTED CONGLOMERATE | |||
|---|---|---|---|
Current Market Price | ₹1,343 | Sector | Diversified |
52-Week High / Low | ₹1,612 / ₹1,156 | Currency | INR |
Market Capitalisation | ₹17.97 lakh cr | Reporting Currency | INR |
Enterprise Value | ₹19.21 lakh cr | Shares Outstanding | 1,353 cr |
FY26 PAT / stated shares (illustrative) | ₹70.7 | Free Float | ~50% |
FY26 price / illustrative PAT-per-share | 19.0x | Promoter Holding | ~50% |
FY26 P/B (Est.) | 2.0x | ADV (3M) | ~₹3,800 cr |
Dividend (FY26) | ₹6.0 / share | Net Debt / EBITDA (FY26) | 0.60x |
EXECUTIVE SUMMARY
The market continues to anchor the group to its O2C and upstream legacy at a moment when the consumer franchises, digital platforms and retail, are already contributing over half of consolidated EBITDA, with margin and free cash flow trajectories that warrant a structurally higher multiple than the energy chassis they are bolted onto.
FY26 closed with record consolidated revenue of ₹11,75,919 crore (up 9.8% YoY), EBITDA of ₹2,07,911 crore (up 13.4% YoY), and PAT of ₹95,610 crore (up 18.3% YoY). The Q4 print, however, reflected energy cycle pressure: PAT fell 12.6% YoY to ₹16,971 crore as O2C margins compressed and KG-D6 production declined. We treat this as cyclical noise and not structural impairment. Net debt remains contained at ₹1.25 lakh crore against EBITDA of ₹2.08 lakh crore, leaving leverage at 0.60x.
"The market is pricing the conglomerate as if digital and retail did not exist. The numbers say they are now the engine room."
Three catalysts compress the realisation timeline: (i) the digital arm's IPO, which the chairman has confirmed is advancing steadily, will force a market-clearing valuation print on the largest digital asset in India; (ii) the retail arm's hyper-local commerce build-out is depressing near-term margins but laying the rails for a multi-year category expansion as Q-commerce share consolidates; and (iii) the New Energy Giga Complex at Jamnagar is approaching first revenue in solar modules and battery storage, converting capex into a measurable EBITDA stream.
Risks are well understood: an extended downcycle in global refining and petrochemical spreads, a softer-than-expected ARPU progression at the digital arm, retail margin pressure from competitive intensity in Q-commerce, and execution risk on the New Energy ramp. We mitigate these in our valuation by applying conservative segment multiples and a 5% holding company discount.
INVESTMENT THESIS — FIVE PILLARS
1. Consumer franchises now drive earnings, not energy
The digital and retail arms combined delivered FY26 EBITDA of approximately ₹1,08,000 crore, representing over 50% of consolidated EBITDA. This crossover is structural, not transitory. The digital arm grew Q4 EBITDA 17.9% YoY with margins expanding 230 basis points to 52.4%. Retail EBITDA margins held at 7.9% even as the company invested heavily in hyper-local fulfilment infrastructure. The market continues to apply a blended energy-style multiple to the entire group, ignoring the mix shift that has already occurred.
2. The digital arm's IPO is a forced re-rating event
Management has explicitly confirmed that listing preparations are advancing. A separately listed digital arm will be valued by global telecom and digital comparables, not by Indian energy multiples. With 524.4 million subscribers, Q4 ARPU of ₹214 (up 3.8% YoY), and 250 million-plus 5G users, the digital arm commands the largest digital footprint in India. We model the digital arm's equity value at approximately ₹11.85 lakh crore on FY28E EBITDA of ₹95,000 crore at 13x EV/EBITDA, with the group's 67% economic stake worth ₹587 per share. The listing event itself crystallises this value.
3. Retail re-acceleration is closer than the print suggests
The retail arm's Q4 FY26 EBITDA growth of 3.1% YoY masks a step-function shift in the operating model. Hyper-local fulfilment investment is in front of revenue. Once unit economics on Q-commerce stabilise — likely by H2 FY27 — operating leverage on a fixed cost base scaled to handle ten times current order density should drive margin expansion. The Pahadi Local acquisition signals continued category extension into FMCG. We model 12% revenue CAGR FY26-FY28E with EBITDA margin recovery to 8.5% by FY28.
4. O2C cycle is bottoming, not breaking
Q4 FY26 O2C revenue grew 12.4% YoY to ₹1,84,944 crore on higher crude prices and domestic fuel volumes, but EBITDA was pressured by global supply chain dislocation linked to the West Asian conflict. Refining margins on the GRM benchmark remain depressed but show early signs of stabilisation. Petchem spreads, particularly in polymers, have priced in significant pessimism. The group's integrated complex at Jamnagar retains a structural cost advantage over global peers. We do not need a strong rebound to make this segment work — a return to mid-cycle margins is sufficient. We model FY28E O2C EBITDA at ₹75,000 crore against the trough of approximately ₹62,000 crore in FY26.
5. New Energy is option value the market is not paying for
Capex of ₹1,44,271 crore in FY26 — over $15 billion — included substantial investment in the Jamnagar Giga Complex. The plan covers solar modules, battery storage, electrolysers for green hydrogen, and fuel cells. First revenue from solar modules is the proximate catalyst. We assign ₹80,000 crore to New Energy on optionality basis (₹59 per share), substantially below management's stated long-run ambition. Any earnings contribution from FY28 onward represents pure upside to our model.
WHERE WE DIFFER FROM CONSENSUS
Sell-side consensus on the group is constructive. The composition of our valuation differs from the median sell-side approach in three specific ways.
First, we apply a higher multiple to the digital arm (13x EV/EBITDA against consensus median of 11x) on the basis that a public listing will trigger inclusion in global emerging-market digital indices, drawing a buyer base that does not currently transact in the stub-asset comparables most analysts use. Second, we apply a more conservative multiple to the retail arm (25x against consensus median of 28-30x) reflecting near-term margin pressure from Q-commerce investment. Net of these two adjustments, our SOTP is broadly aligned with consensus average.
Third, we explicitly assign positive value to the New Energy build-out at ₹80,000 crore. Most sell-side models continue to treat this as a placeholder or zero-value optionality. We view this as a directional error: capital has been deployed, supply contracts are in place, and the first solar module line is approaching commissioning. The asset is real even if the earnings contribution is not yet visible.
"Conviction does not come from consensus; it comes from where the consensus is structurally wrong."
BUSINESS SNAPSHOT — FIVE ENGINES
The group operates across five distinct business engines, each with separate competitive dynamics, capital intensity, and margin structure. The consolidated entity is best understood as a portfolio rather than a single operating company.
SEGMENT | FY26 REVENUE (₹CR) | FY26 EBITDA (₹CR) | EBITDA MARGIN | STRATEGIC POSTURE |
|---|---|---|---|---|
Digital platforms | ~1,73,000 | ~76,500 | ~52% | Compounder, listing-bound |
Retail | ~3,40,000 | ~31,500 | ~7.9% | Scale, omnichannel build |
Oil-to-Chemicals (O2C) | ~6,40,000 | ~62,000 | ~9.7% | Cash cow, cycle bottom |
Oil & Gas (E&P) | ~24,500 | ~18,500 | ~75% | Run-off, KG-D6 decline |
New Energy | Pre-revenue | Negative | n.m. | Capex deployment phase |
The mix shift is the central observation. Five years ago O2C and E&P contributed approximately 70% of consolidated EBITDA. Today, digital and retail combined contribute over 50%. The valuation framework has not yet caught up with the operating reality.
Q4 FY26 AND FULL-YEAR PRINT: WHAT MATTERED
Q4 FY26 produced gross consolidated revenue of ₹3,25,290 crore (up 12.9% YoY), but PAT contracted 12.6% YoY to ₹16,971 crore on energy segment weakness. The headline disappointment is misleading. Underneath, the quarter delivered three pieces of evidence that strengthen the medium-term thesis.
Digital platforms — operating leverage emerging
Q4 revenue of ₹44,928 crore was up 12.7% YoY, but the more important number is EBITDA growth of 17.9% YoY to ₹20,060 crore, with margins expanding 230 basis points to 52.4%. PAT grew 13% YoY to ₹7,935 crore. ARPU rose 3.8% YoY to ₹214, supported by 5G plan migration. Subscriber base reached 524.4 million with quarterly net additions of 9.1 million. The fixed-wireless service crossed 13 million subscribers, retaining global leadership in fixed wireless access scale. The streaming platform averaged 500 million monthly active users.
Retail — investment phase, not stagnation
Q4 revenue grew 10.8% YoY to ₹98,232 crore. EBITDA growth of 3.1% YoY and PAT growth of 0.5% YoY look optically weak, but the gap between revenue growth and earnings growth is the cost of building dark stores and last-mile capability for hyper-local commerce. EBITDA margin held at 7.9%, indicating that the investment is sized appropriately to revenue capacity, not running ahead of it. We expect this gap to close from H2 FY27.
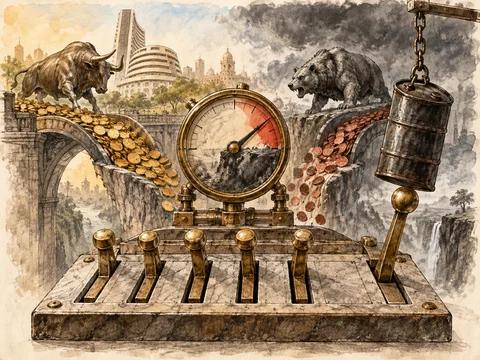
Figure 01 · Conceptual framework
The valuation bridge that matters
O2C — pressure point of the quarter
Q4 revenue of ₹1,84,944 crore (up 12.4% YoY) was supported by approximately 12% higher crude prices and stronger domestic fuel volumes, but margin compression from West Asian supply chain disruption pushed segment EBITDA down. Management explicitly highlighted that the team diverted streams toward LPG production and ensured continuous fuel availability domestically — signalling that part of the margin sacrifice was a deliberate national-priority allocation rather than market failure.
Oil & Gas E&P — managed decline
Q4 revenue declined 8.9% YoY to ₹5,867 crore on lower KG-D6 production and weaker gas price realisations. Management confirmed gas from KG-D6 has been diverted toward priority sectors. We expect this segment to contribute a declining share of EBITDA over the forecast horizon and assign it a low single-digit weight in our SOTP.
"Q4 was not a thesis-breaker. It was the printed bottom of the energy cycle inside a portfolio that no longer depends on it."
Capex and balance sheet
Full-year capex of ₹1,44,271 crore (≈$15.2 billion) was directed primarily at New Energy build-out, telecom network expansion, and retail infrastructure. Net debt of ₹1,24,717 crore against FY26 EBITDA of ₹2,07,911 crore yields net debt to EBITDA of 0.60x — a comfortable position that preserves capacity for further capex without balance sheet stress. The board declared a final dividend of ₹6 per share for FY26.
SUM-OF-THE-PARTS VALUATION
Our valuation is derived from a sum-of-the-parts framework applied to FY28E earnings. Each segment is valued using a multiple appropriate to its growth and margin profile, with adjustments for net debt and minority economic interests where relevant. A 5% holding company discount is applied to reflect structural conglomerate value friction.
SEGMENT | FY28E EBITDA (₹CR) | MULTIPLE | EV (₹CR) | GROUP STAKE | PER SHARE (₹) |
|---|---|---|---|---|---|
Digital platforms | 95,000 | 13.0x | 12,35,000 | 67% | 587 |
Retail | 40,000 | 25.0x | 10,00,000 | 85% | 608 |
O2C | 75,000 | 7.0x | 5,25,000 | 100% | 388 |
Oil & Gas E&P | 15,000 | 5.0x | 75,000 | 100% | 55 |
New Energy (option) | n.m. | DCF / option | 80,000 | 100% | 59 |
Media JV | 4,500 | 12.0x | 54,000 | 75% | 30 |
Treasury / Other | — | Book | 35,000 | 100% | 26 |
The valuation is anchored on segment economics rather than blended group multiples. Per share contributions of ₹587 from the digital arm and ₹608 from the retail arm together account for 70% of our gross SOTP, validating the consumer-led re-rating thesis. O2C contributes a meaningful but not dominant ₹388 per share, while Oil & Gas E&P at ₹55 per share reflects realistic expectations of managed run-off.
Sensitivity is concentrated in two variables: the multiple ascribed to the digital arm post-listing (each one-turn change in the EV/EBITDA multiple moves the SOTP value per share by approximately ₹45), and the assumed FY28E EBITDA margin for the retail arm (each 100 basis points of margin expansion moves the SOTP value per share by approximately ₹65).
EARNINGS FORECAST — FY26 TO FY28E
Our forecast horizon covers FY26 (reported), FY27E, and FY28E. Revenue growth is driven primarily by the digital arm (subscriber additions, ARPU expansion through 5G migration) and the retail arm (footprint addition and digital commerce scale-up). EBITDA margin expansion of approximately 80 basis points over the forecast horizon reflects mix shift toward higher-margin consumer segments and gradual O2C cycle recovery.
₹ CRORE | FY26 (REPORTED) | FY27E | FY28E |
|---|---|---|---|
Revenue | 11,75,919 | 12,93,500 | 14,22,850 |
YoY growth | +9.8% | +10.0% | +10.0% |
EBITDA | 2,07,911 | 2,33,000 | 2,59,500 |
EBITDA margin | 17.7% | 18.0% | 18.2% |
Depreciation & Amortisation | (56,500) | (62,000) | (67,500) |
Net Interest Expense | (24,000) | (23,500) | (22,000) |
Profit before tax | 1,27,411 | 1,47,500 | 1,70,000 |
Reported PAT | 95,610 | 1,11,200 | 1,28,500 |
Illustrative PAT / stated shares (₹) | 70.7 | 82.2 | 95.0 |
Price / illustrative PAT-per-share (at April CMP ₹1,343) | 19.0x | 16.3x | 14.1x |
Capex | (1,44,271) | (1,30,000) | (1,15,000) |
Net Debt | 1,24,717 | 1,15,000 | 95,000 |
Net Debt / EBITDA | 0.60x | 0.49x | 0.37x |
Capex steps down through the forecast horizon as the New Energy build-out matures and the digital arm's 5G capex moderates. Falling capex combined with rising EBITDA drives a sharp improvement in free cash flow generation, taking net debt to EBITDA from 0.60x in FY26 to 0.37x by FY28E. This deleveraging path supports both higher dividends and the optionality for opportunistic acquisitions in the consumer space.
CATALYST AND TRIGGER CALENDAR
We track six discrete catalysts over the next 12-18 months. The first three are the report’s central catalyst assumptions; their timing and financial impact are not assured. The remaining items are additional scenarios.
CATALYST | TIMING | DIRECTION | MECHANISM |
|---|---|---|---|
Digital arm IPO | FY27 | Positive | Forced re-rating via global comparables |
New Energy first revenue | H2 FY27 | Positive | Solar module commercialisation |
Retail margin recovery | H2 FY27 | Positive | Q-commerce unit economics inflection |
O2C cycle recovery | FY27-FY28 | Positive | Refining and petrochemical spread normalisation |
Telecom tariff hike | FY27 | Positive | Industry-wide ARPU step-up |
West Asia escalation | Continuous | Negative | O2C feedstock and supply chain disruption |
KEY RISKS
Macroeconomic and geopolitical
Persistent escalation in West Asia could disrupt crude flows through the Strait of Hormuz, drive sustained input cost inflation in O2C, and squeeze margins beyond the levels currently absorbed in our forecast. The Q4 FY26 print already reflected approximately ₹2,000-3,000 crore of margin compression that management attributed to supply chain disruption. A further leg of dislocation would push our O2C estimates lower.
Telecom competitive intensity
Bharti Airtel and Vodafone Idea remain aggressive on 5G subscriber acquisition. A delayed industry-wide tariff hike, or a tariff hike that fails to translate to meaningful ARPU expansion at the digital arm, would compress our FY28E EBITDA estimate for the segment. Each ₹10 of monthly ARPU shortfall applied to the stated subscriber base translates to roughly ₹6,000 crore of annual revenue; the EBITDA impact depends on incremental margins.
Retail margin pressure
The Q-commerce category is fragmented and competitively intense. Zepto, Blinkit, and Instamart have been growing aggressively in metropolitan markets. The retail arm's hyper-local build-out positions the business to compete, but margin recovery is contingent on order density per store reaching break-even thresholds. A delay of two to three quarters in this transition would extend the period of margin pressure.
New Energy execution
The Giga Complex involves first-of-scale deployment for the group across multiple technology stacks — silicon module manufacturing, electrolysers, battery cells, and fuel cells. Execution risk is non-trivial. Capex inflation, technology-specific commissioning delays, or weaker-than-expected polysilicon and module pricing would defer the timeline to first revenue and reduce the option value we currently assign to the segment.
Holding company structure
Conglomerate discounts can widen as well as narrow. If the digital arm's listing is delayed beyond FY27, or if proceeds are absorbed into further capex rather than returned to shareholders, the consolidated entity may continue to trade at a structural discount to underlying segment values.
"Risk in conglomerates is rarely about any single segment. It is about the timing of capital cycling between segments."
CONCLUSION
The investment case rests on a structural re-rating triggered by the digital arm's listing, a margin recovery cycle in the retail arm as Q-commerce unit economics stabilise, and a cyclical recovery in O2C as global refining and petrochemical spreads normalise from current depressed levels.
FY26 results confirm the consumer franchises are now the dominant earnings engine, contributing over 50% of consolidated EBITDA. The market continues to price the conglomerate as if the energy chassis were the entire story. A separately listed digital arm forces the market to clear a valuation that current sell-side stub-asset comparables cannot anchor. The retail arm's near-term margin pressure is investment-driven rather than structural, and unwinds as fulfilment infrastructure scales.